

Benefits and Tax Credits
Underlying pressures mean benefit spending has not fallen, despite significant cuts in generosity
The current government has made significant changes to the benefit and tax credits system. Many have been made in order to reduce expenditure as part of the government’s efforts to reduce the deficit . There have been some increases in generosity too, however. And other changes, like Universal Credit, represent major changes in the way benefits and tax credits are structured and paid to individuals and families.
The IFS is well known for its analysis of the distributional impact of taxes and benefits. But we also look more broadly at benefits policy and the merits (or otherwise) of policy changes.
Benefits expenditure
The current government has made significant changes to the benefit and tax credits system. Many have been made in order to reduce expenditure as part of the government’s efforts to reduce the deficit. There have been some increases in generosity too, however. And other changes, like Universal Credit, represent major changes in the way benefits and tax credits are structured and paid to individuals and families.
Looking ahead, both the Conservatives and Liberal Democrats have said they would look for further cuts to welfare in the next parliament. But their firm plans contribute only a small fraction of the savings they say they want to make – finding the rest would involve tough choices, and potentially further big cuts to areas like tax credits or housing, child or disability benefits.
Table 1. Benefit expenditure by benefit (2015–16)
|
Benefit |
Amount Spent (£s billion) |
% of total |
|
State pension |
92.1 |
41.8 |
|
Child and working tax credits |
29.9 |
13.6 |
|
Housing benefit |
26.0 |
11.8 |
|
Disability living allowance, personal independence payments and attendance allowance |
21.6 |
9.8 |
|
Incapacity benefit and employment and support allowance |
15.1 |
6.9 |
|
Child benefit |
11.7 |
5.3 |
|
Pension credit |
6.5 |
3.0 |
|
Other |
16.9 |
7.7 |
Source: Authors’ calculations using DWP benefit expenditure forecasts
By far the largest benefit is the state pension, on which £92.1 billion will be spent, 42 % of the total. This fraction has been increasing in recent years, because of population ageing and the fact that pensions have not been subject to the same cuts affecting most other benefits. Other large benefits include the child and working tax credits (£29.8 billion), and Housing benefit (£26.0 billion). In contrast, Jobseekers’ Allowance, included in the “Other” category, accounts for just £2.5 billion of expenditure.
Figure 1 shows that benefit expenditure has been slowly falling as a share of national income since 2012-13 (when it represented 12.6% of GDP). Under current policy that slow fall is set to continue, with benefit spending reaching 11.1% of GDP in 2018–19. This follows big increases in spending during the late 2000s as the recession led to both increases in means-tested benefits, and reduced the level of GDP. This means that in 2018–19, benefits spending measured relative to GDP is forecast to still be a bit above its pre-crisis levels.
Figure 1. Expenditure on social security benefits and tax credits: 1997–98 to 2018–19 [get the data for this graph]
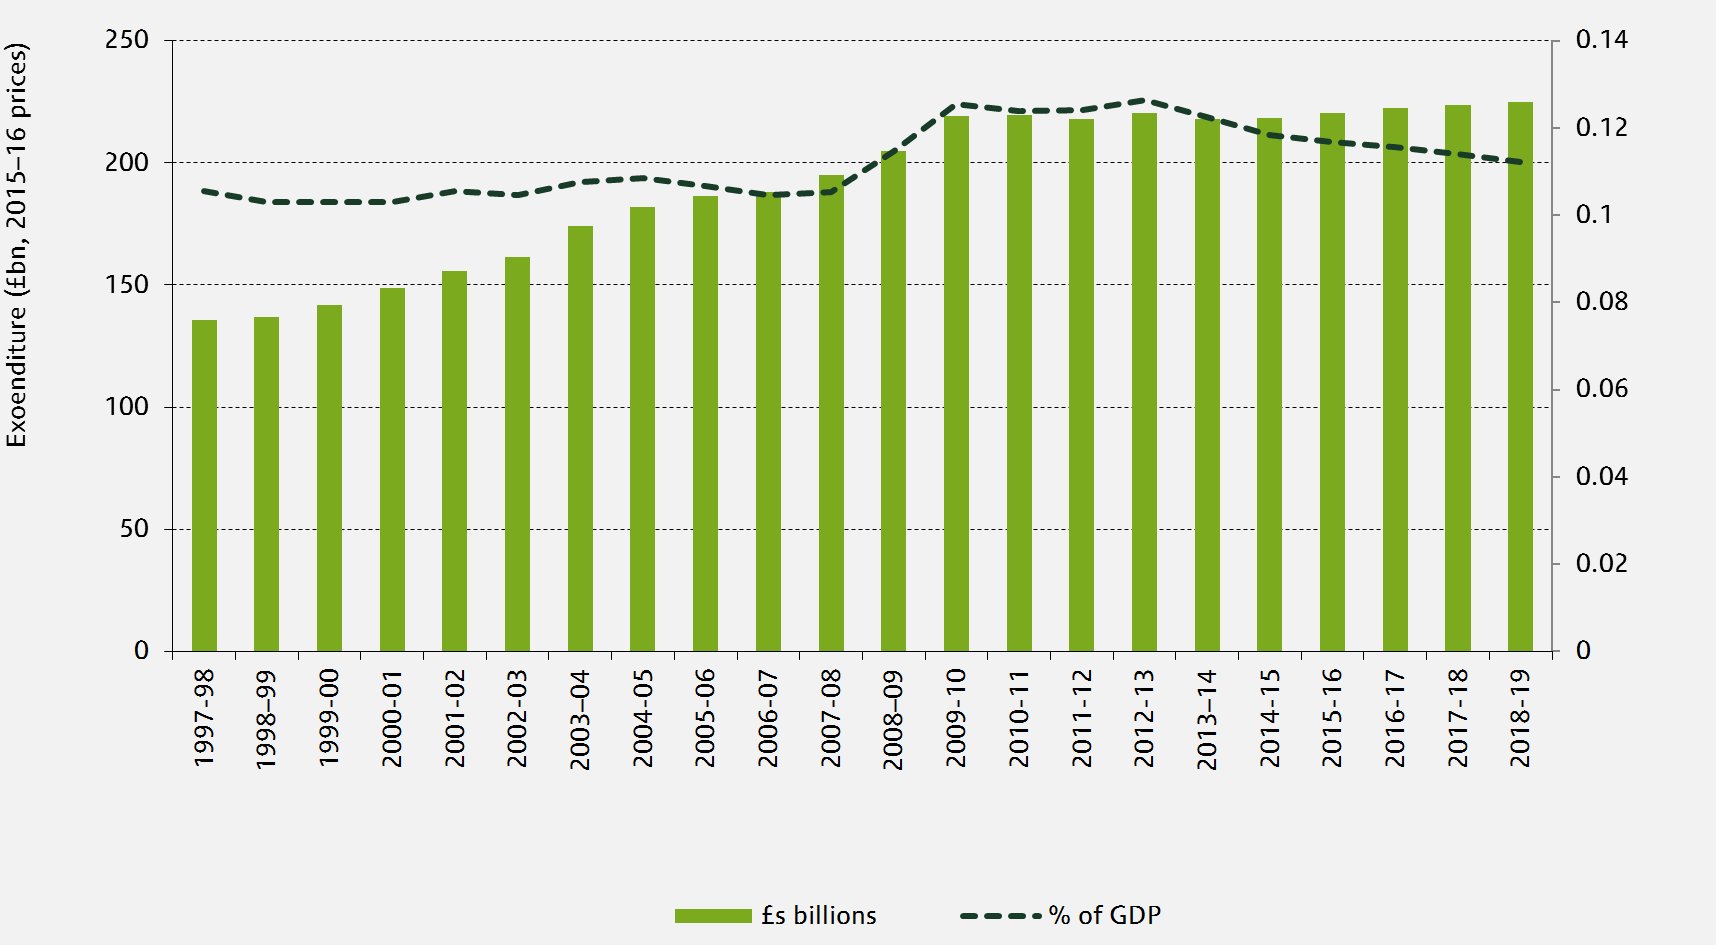
Note: Excludes spending on council tax benefit to ensure comparability over time.
Source: IFS researcher calculations using DWP, HMRC, OBR and DSDNI data.
Measured in £s billions, benefits spending is not expected to fall between 2010–11 and 2015–16, but rather to remain roughly flat in real terms. Nevertheless this stands in stark contrast to the pre-crisis period: benefits expenditure grew by an average of 3.7% per year between 1997–98 and 2007–08 (and by 4.1% a year between 2007–08 and 2010–11, during and immediately post-crisis).
Benefit policy changes under the coalition government
Many of the changes to the benefit system since 2010 have been made in order to reduce expenditure. In total, benefits policy changes are forecast to reduce benefits spending in 2015–16 by £16.7 billion compared to what would have been spent without those changes. Most of the cuts affect working-age claimants only. Indeed, the introduction of the pensions ‘triple lock’ and increases in the generosity of pension credit are reforms which represent net giveaway to pensioners of around £4.8 billion in 2015–16, relative to the plans the coalition government inherited.
There have also been major structural reforms. The biggest was the announcement that 6 existing means-tested benefits will be replaced by a new Universal Credit. The aim is to simplify the benefits claim process, and boosting employment and earnings progression through a revamped system of conditionality and stronger financial work incentives for those currently facing the weakest incentives. Implementation of the policy has been much delayed, however, (it was meant to be well under way by now), and on current plans, roll-out to existing benefit claimants is not expected to begin until January 2018 – by which time it was initially meant to be complete. The other major structural change announced is the introduction of a single tier pension beginning from 2016, discussed in more detail in our analysis of pensions.
Some of the cuts look like relatively sensible ways to reduce expenditure. Uprating benefits in line with CPI rather than RPI or Rossi by default is the biggest single cut (£4.1 billion) and represents a move away from inflation measures that have technical problems that mean they are known to systematically over-estimate true inflation. The 1% ceiling on benefit increases in place for April 2013, April 2014, and April 2015 (£1.7 billion), and freezes to child benefit and working tax credits (£3.0 billion), also represent big savings spread over a large number of claimants. Some changes to housing benefit for private sector tenants, and changes to disability benefits (£1.7 billion) also represent coherent if controversial policies.
However, other changes seem less well designed. For instance, the “triple lock” for the state pension means that future levels of the state pension will depend not only on the level of inflation and earnings growth, but also the volatility of them. It also means the state pension is likely to go up more quickly than both prices and earnings, which could cost many billions of pounds a year if it is retained long-term (it will already be costing £4.5 billion a year in 2015–16 compared to earnings indexation). And changes to the way the maximum that can be claimed in housing benefit in the private sector is uprated mean the amount that can be claimed in future can depend upon historical volatility in rents: a very strange set of affairs. The localisation of council tax benefit also risks undermining the drive towards simplicity and improved work incentives that is embodied by the Universal Credit.
Perhaps the most controversial change has been reductions in housing benefit for social housing tenants deemed to have at least one spare bedroom – the “bedroom tax”, to its critics. In cash terms this cut was actually not that big in aggregate (£0.5 billion) but it affects a relatively small fraction of claimants meaning the average loss to each is around £700 a year.
The government has also introduced two “caps” to benefit spending. One, the “benefits cap”, limits the total amount that most non-working families can claim in benefits to £26,000 a year (or £18,200 per year for single adults), irrespective of what the individual benefit rules allow. In practise it affects largely those with high housing costs and/or many children, and will save less than £0.2 billion in 2015–16.
The “welfare cap” on the other hand applies to aggregate spending on “welfare in scope” (which is all benefit and tax credit spending excluding the state pension, jobseekers allowance, and housing benefit for those receiving jobseekers allowance). If spending on “welfare in scope” is set to exceed the cap, a parliamentary vote must be held to either revise the cap, or find ways to reduce expenditure (a 2% margin of error for forecast errors is allowed). The idea is that this will provide government with stronger incentives to find savings to offset unexpected increases in benefits spending.
The parties’ plans for the future
The Conservative Party have said that they would be looking for a further £12 billion in benefit cuts to take effect in the next parliament. But announced plans to reduce the benefits cap to £23,000 a year, cut housing benefit for under 21s on Jobseeker's Allowance, and freeze most working-age benefits for two years would save less than £2 billion. Delivering the remaining £10 billion or so through cuts to working-age benefits alone would mean additional cuts of around 10% of spending on this group. Further freezes would be possible, but even extending the freeze to five years would leave billions of pounds' more cuts required. This is an indication of the challenge in making further benefit savings whilst protecting the biggest single area of expenditure – state pensions and other benefits aimed at pensioners.
The Lib Dems have said they would look for £3.5 billion of savings from benefit cuts; confirmed plans for two years of capping increases in most working-age benefits at 1%, together with their plans to remove winter fuel payments and free TV licenses from pensioners paying the higher or additional rate of income tax would save less than half a billion.
The Labour Party have not set out their plans for benefit spending, but their criticism of the Conservatives’ proposals suggests they would seek fewer cuts. They would remove winter fuel payments (but not free TV licences) from the same group of pensioners as the Liberal Democrats – saving £150 million. The only other “cut” they have mentioned is a further 1% cap on child benefit increase – but given forecast inflation of just 0.2% this would not bind and would therefore save nothing. Labour has also suggested changes to Jobseeker’s Allowance so that those aged from 18 to 21 with few qualifications would instead receive a means-tested Youth Allowance while obtaining qualifications or training, and would receive no allowance if they refused to undertake such studies. And they propose a higher rate of contributory Jobseeker’s Allowance for those who had been working for at least five years prior to claiming. The party also plan to undo recent changes to housing benefit for tenants of social housing to “abolish the bedroom tax” (or, alternatively, to “re-introduce the spare room subsidy”).
IFS election 2015 publications
Briefing notes
Stuart Adam, James Browne, Carl Emmerson, Andrew Hood, Paul Johnson, Robert Joyce, Helen Miller, David Phillips, Thomas Pope and Barra Roantree, 'Taxes and benefits: the parties' plans', IFS briefing note BN172, election briefing note 2015 No. 13, ISBN: 978-1-909463-90-5
Andrew Hood and David Phillips, 'Benefit spending and reforms: the coalition government's record', Institute for Fiscal Studies: 28 January 2015, IFS briefing note BN160, election briefing note 2015 No. 3, ISBN: 978-1-909463-74-5
James Browne and William Elming, 'The effect of the coalition’s tax and benefit changes on household incomes and work incentives', Institute for Fiscal Studies: 23 January 2015, IFS briefing note BN159, election briefing note 2015 No. 2, ISBN: 978-1-909463-73-8
The 2015 IFS Green Budget
James Browne and Andrew Hood, Options for reducing spending on social security, The 2015 IFS Green Budget, Carl Emmerson, Paul Johnson and Robert Joyce (eds.), February 2015
Observations
Andrew Hood and David Phillips, Substantial cuts made, but biggest changes to the benefit system yet to come, Institute for Fiscal Studies: 28 January 2015, Observation
Useful resources
The IFS’s Benefits Survey provides a detailed description of all the main benefits (and many smaller ones too!) in Great Britain. More information on the long-term trends and recent changes to the benefit system and benefit expenditure can be found in an IFS Briefing Note.
We discuss how to define and categorise welfare spending in this Observation, and outline and explain recent changes in spending in this Observation.
In our 2013 Green Budget we analysed and evaluated a number of major reforms to the benefit system taking effect in 2013 (see chapter 7) and at options for further cuts to social security spending (see chapter 8).
We have examined the effects of benefit changes (and tax changes) on work incentives in a working paper, and have looked at how confident we can be about their effects on employment).
We have also analysed the delayed Universal Credit, the coalition government’s flagship welfare policy. A summary of key features can be found in Chapter 7 of the 2013 Green Budget; and an assessment of its distributional and work incentive effects in this working paper.