

Growth and Productivity
Productivity remains weak, and the UK has lost its ranking as an innovation leader in the EU
Between the pre-recession peak and post-recession trough UK output fell by 6% and output per worker by 4%. It wasn’t until the third quarter of 2013 that real output returned to its pre-recession level. Estimates suggest that potential output has also fallen substantially since 2007 – that is, the UK is not expected to recover to the level of output that would have occurred had the pre-recession trend continued. Output is now growing. However, the OBR estimates that recent growth largely reflects a recovery in demand rather than an improvement in underlying supply potential. The continuing uncertainty around the forecasts for growth in potential output is linked to the uncertain outlook for productivity.
Productivity, measured either as output per worker or per hour worked, fell sharply in the recession. Since then, productivity growth has been particularly weak, and, as a result, output per hour worked remains substantially below where it would have been had the pre-recession trend continued (see Figure 1). This is one of the factors feeding into low earnings growth.
Figure 1: Output per hour worked relative to pre-recession trend [get the data for this graph]
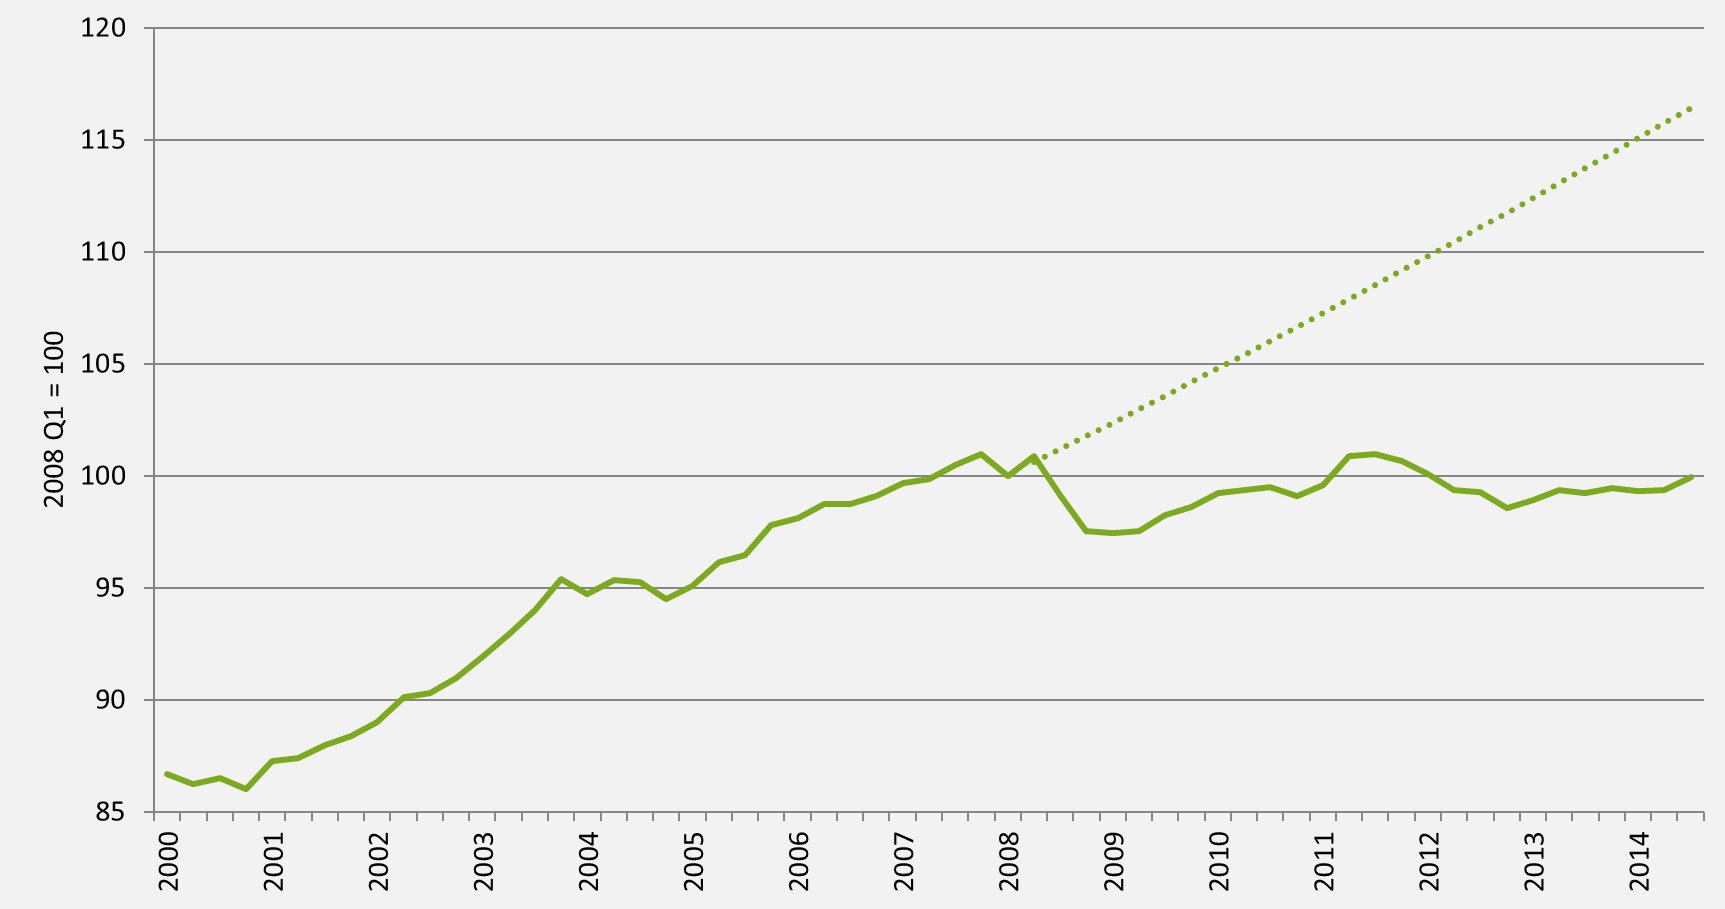
Source: Author’s calculation using ONS data series ABMI and YBUS. Trend uses the average quarterly growth rate for the decade prior to 2008.
The poor performance of productivity has become known as the productivity puzzle. Evidence suggests that there are a number of factors that help solve this puzzle. Recent IFS work has highlighted the role of unexpectedly robust labour supply and falling real wages. In ongoing work we are exploring the role of investment and the allocation of capital across the economy. There is continuing debate about the extent to which the loss of productivity might be permanent rather than temporary.
The UK has long had a lower level of productivity than some other developed countries including France, Germany and the US. This productivity gap, which had been closing over the 2000s, has now increased back to near 1991 levels (see figure 2).
Figure 2: UK productivity gap with G7 countries [get the data for this graph]
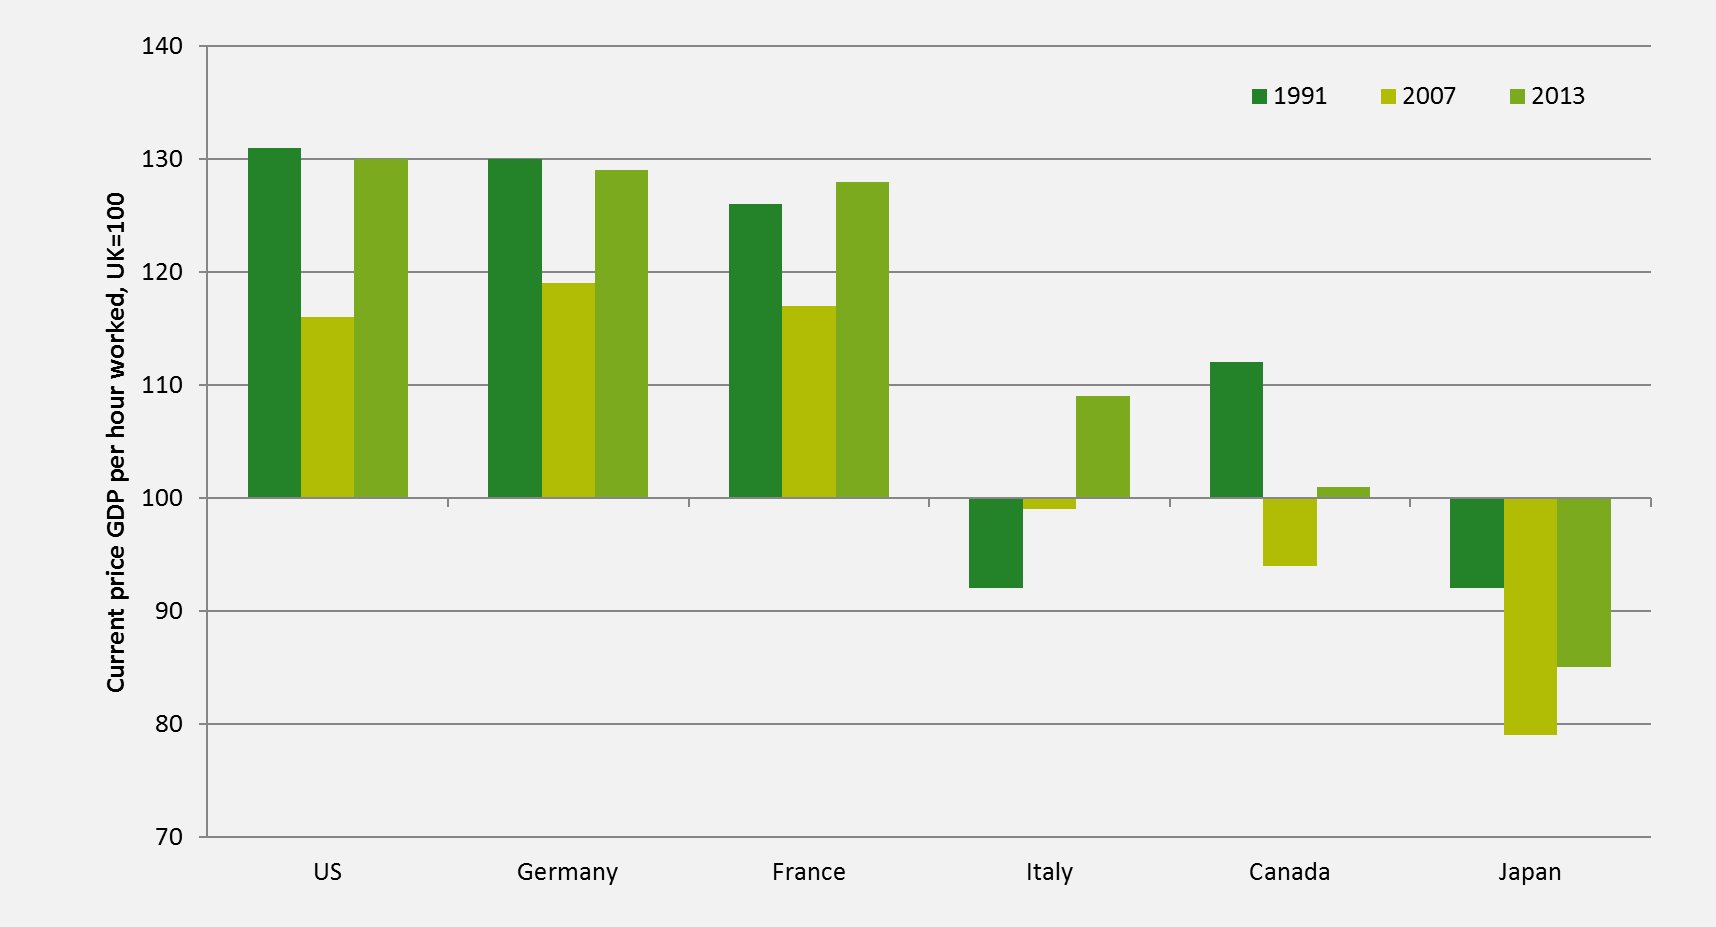
Source: ONS (2014), International Comparisons of Productivity.
Policy
There is a large range of policies that can affect the economy’s growth potential over the medium term. Many of these relate to the environment in which private sector companies operate, including policies around competition, regulation, planning, access to finance, education and skills, infrastructure investment and the design of the tax system. The government highlighted many of these factors in a report in November 2010, which stated an ‘overriding priority [...] to return the UK economy to balanced, sustainable growth’. Since then, a variety of reports, reviews, strategies, plans and policy changes have followed. One of the central elements has been reform to the corporate tax system {link to business tax part of website}. There has also been a move to define a modern industrial strategy and, as part of this, to provide support to 11 sectors that have been identified as important for the UK’s growth prospects.
Over the 2000s there were large increases in education spending. However, the UK remains towards the middle of OECD rankings on student performance. The UK is also relatively unusual internationally in that older adults appear to have higher literacy and numeracy skills than younger adults, suggesting little improvement in educational attainment over time.
Investment in science and technology
The extent to which we invest in researching and developing new ideas is also an important determinant of productivity growth, and therefore economic growth, in the medium term. In this area the UK has some long running strengths and weaknesses. Notably, the UK punches above its population weight in terms of the world share of scientific papers and citations. It is the fourth largest producer of PhD students and UK researchers are active in global collaborations. However, the UK invests a lower share of GDP in R&D than many other countries, including France, Germany, the US and, since 2011, China. There is also a weakness in the extent to which science is commercialised and translated into new products and services. The UK’s position may have worsened since the great recession. The number of researchers in the UK has been growing more slowly than in other G8 countries and in 2014 the UK lost its ranking as an ‘innovation leader’ in the EU’s Innovation Scoreboard.
Governments around the world intervene in innovation markets through subsidies for research and direct spending on science. The rationale for such policies is the failure of markets to provide sufficient incentives for private investment in innovative activities because they generate benefits not only for the individuals and firms carrying them out but also for third parties.
The UK government supports private sector investment in research and innovation in a number of ways, including through R&D tax credits. Many of the policies, including the new Catapult Centres, are run through Innovate UK (previously called the Technology Strategy Board), which in the financial year 2013-14 had a budget of around £586million.
The government also invests directly in science by funding researchers and research infrastructure, such as laboratories and universities. A large part of the UK government’s direct funding goes through the science budget, which currently funds the Research Councils, three of the National Academies and a block grant to the higher education funding council. The coalition ring fenced the resources element of the science budget between 2010-11 and 2014-15, freezing it at £4.6bn per year in cash terms. However, this implied real terms cuts. Over the same period, capital expenditure was cut in nominal (and therefore also real) terms.
Failing to invest sufficiently in science and skills can be short sighted. The impact of such spending occurs in the long run, in the form of higher productivity and economic growth. Being able to compete with other countries, including the US and China, in 10 years time requires investment in skills and research today.
Useful resources
The productivity puzzle is discussed chapter 3 of the 2013 Green Budget.
The link between the productivity puzzle and employment and wages is explored in this paper. Recent work also discusses links with firm investment and the allocation of capital.
The effect of taxes on growth is discussed in chapter 8 of the 2012 Green Budget.
This briefing note looks at productivity, innovation and the corporate tax environment in the run up to the 2010 election.
This Green Budget chapter discusses the ways in which government supports research and innovation.