

Living Standards
Living standards have been through a severe and prolonged squeeze
In 2012–13, which remains the last full year for which we have official data on household incomes, median net household income in the UK was 1.6% below its pre-recession (2007-08) level and 3.6% below its 2009–10 peak, after adjusting for RPIJ inflation. Due to this, and the fact that income growth had been sluggish even in the years prior to the recession, 2012–13 real median income was approximately the same as in 2005–06.
Projections by IFS researchers suggest that, in 2014-15, real median income is close to its 2007-08 level - though still about 2% below its 2009-10 peak, as real household incomes had continued to grow slowly during the recession, in part due to temporary fiscal stimulus measures such as the temporary cut to the main rate of VAT.
Figure 1. Real (RPIJ-adjusted) UK median income (2007-08 = 100) [get the data for this graph]
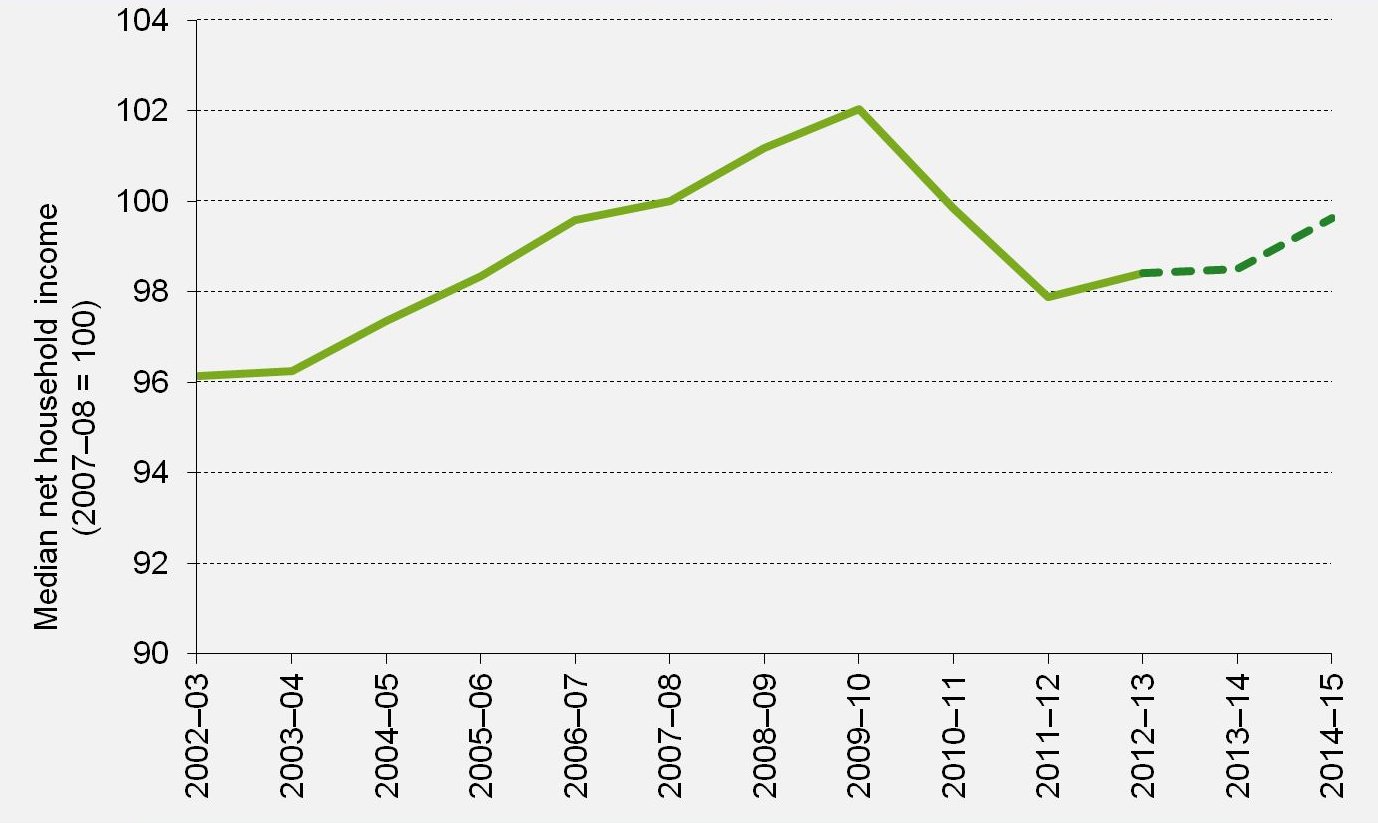
Note: Dotted lines indicate projections from IFS researchers. This first appeared in Cribb, Hood and Joyce (2015).
Different demographic groups have been affected differently. IFS research has highlighted how younger workers have seen larger reductions in employment and in pay than older workers, and how pensioner incomes have continued to grow in real terms since the crisis began. As a result the average incomes of working-age individuals remain below pre-crisis levels, and particularly so for the youngest adults. By income, the story is different too, though the differences are more subtle. Figure 2 shows that both low and high income households have seen income falls since the start of the recession, but these have tended to come at different points in time. As workers’ pay fell in real terms during and immediately after the recession, there were bigger falls in income for households further up the income distribution. After cuts to working-age benefits and net tax rises for those towards the very top began to take effect, there were bigger falls in income towards the bottom of the distribution and for a smaller group towards the top. The likely net result is that income falls look somewhat larger towards the top of the distribution since the crisis. However, the precise timing of the income falls has varied substantially across the distribution.
Figure 2. Change in real household income from 2007-08, by percentile point [get the data for this graph]
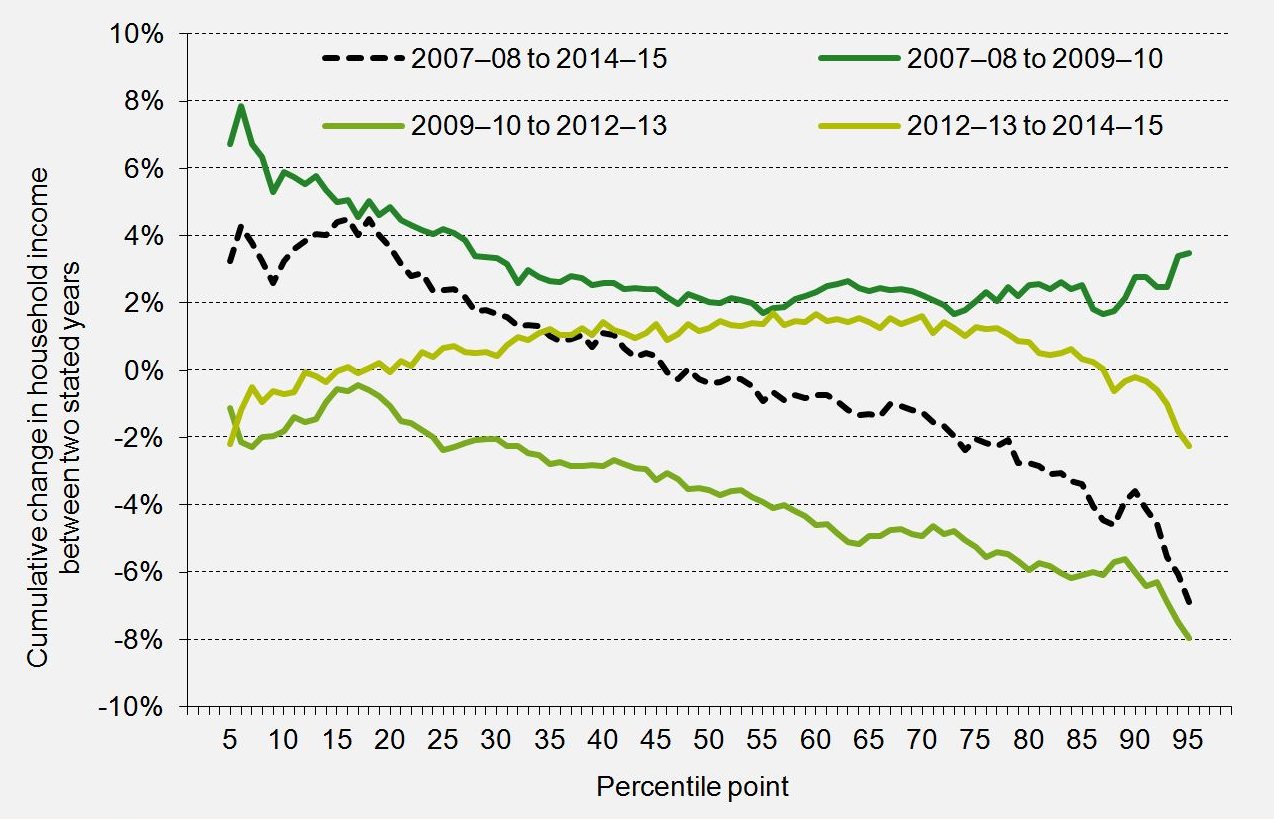
Note: Data for 2013-14 and 2014-15 are estimated using IFS simulations. This first appeared in Cribb, Hood and Joyce (2015).
However, this does assume that all households face the average inflation rate. Lower-income households have experienced higher rates of inflation than richer households since the recession, primarily due to price changes between 2007-08 and 2009-10; accounting for this wipes out most of the reduction in inequality that would otherwise have occurred. This is shown by figure 3.
Figure 3. Change in real household income from 2007-08 to 2014-15, by percentile point [get the data for this graph]
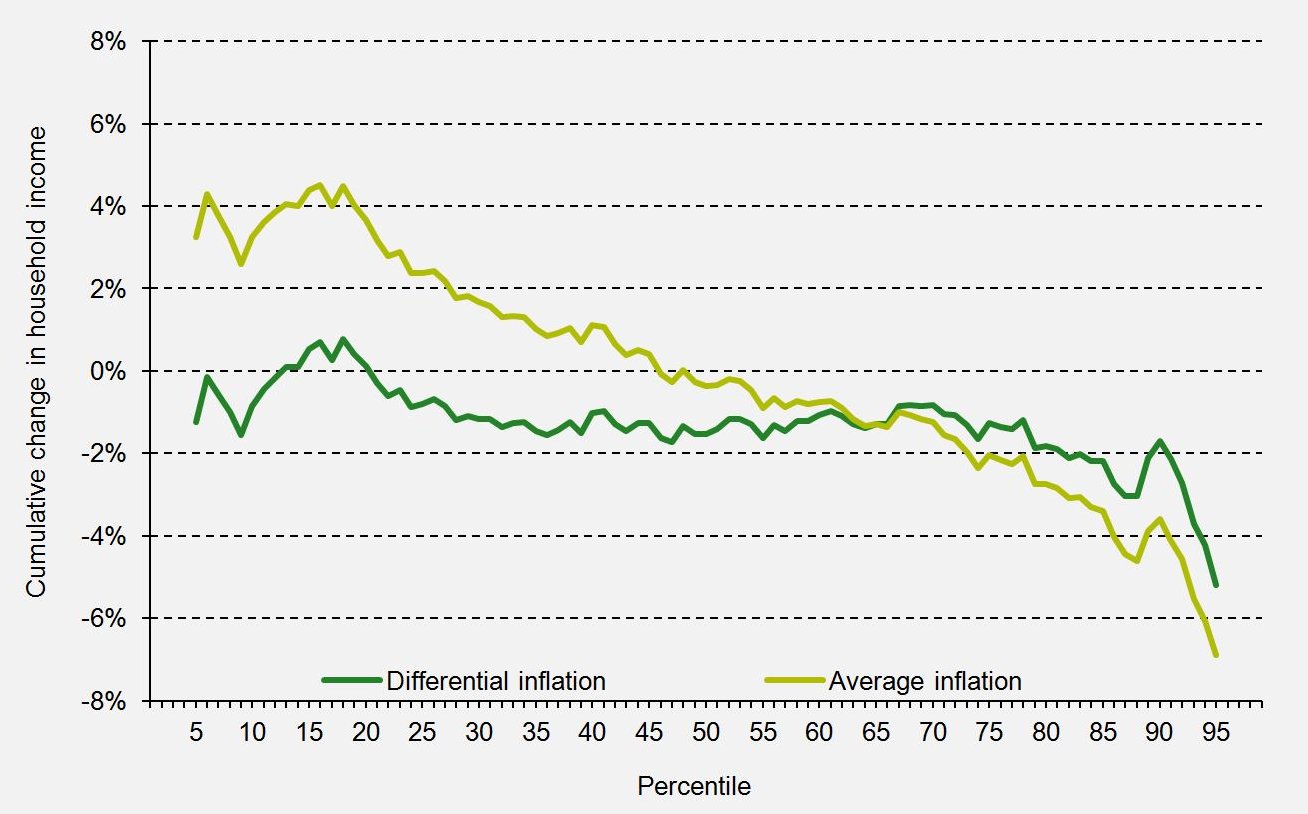
Note: Data for 2014-15 are estimated using IFS simulations. These data are taken from Cribb, Hood and Joyce (2015).
IFS election 2015 publications
Briefing notes
Chris Belfield, Daniel Chandler and Robert Joyce, 'Housing: trends in prices, costs and tenure', Institute for Fiscal Studies: 19 February 2015, IFS briefing note BN161, election briefing note 2015 No. 4, ISBN: 978-1-909463-79-0
Jonathan Cribb, Andrew Hood and Robert Joyce, 'Living standards: recent trends and future challenges', Institute for Fiscal Studies: 4 March 2015, IFS briefing note BN165, election briefing note 2015 No. 8, ISBN: 978-1-909463-82-0
Observations
Chris Belfield, Daniel Chandler and Robert Joyce, Today's young adults are much less likely to own a home than their parents' generation, but those owning a home well before the crisis have gained from house price increases and a sharp fall in housing costs, Institute for Fiscal Studies: 19 February 2015, Observation
Useful resources
A presentation given at the IFS Budget briefing 2015 looked at overall trends in household incomes and the impact of tax and benefit changes announced in the Budget.
Our latest annual report on Living Standards, Poverty and Inequality in the UK analyses trends in the distribution of household income, up to and including the latest data available for 2012–13. It focuses particularly on changes since the onset of the recent recession.
This spreadsheet shows how key measures of average incomes, poverty and inequality have evolved since 1961.
This observation summarises some of the key stories on changes in real incomes as of November 2014.
This chapter from the 2014 IFS Green Budget looked at the squeeze on incomes across the income distribution up to 2013–14, and how this has been affected by the inflation rates faced by different kinds of households. Much of this work will be updated as part of IFS’ election briefing note series.
This article looked at the short term and likely medium-term implications of the recent recession for the income distribution in the UK. Note that it was produced before Budget 2013, so it does not account for policy changes or the OBR’s macroeconomic forecast changes in Budget 2013 or afterwards. Much of this work will be updated as part of IFS’ election briefing note series.
This article looked in detail at changes in wages and employment across the population during the recession. Much of this work will be updated as part of IFS’ election briefing note series.
This article analyses changes in income inequality and poverty under the previous Labour governments.