

Public Spending
This government has delivered substantial spending cuts; big differences in parties’ plans for next parliament
The government is part way through a large fiscal consolidation, of which most is planned to come through cuts to public spending (see Public Finances). The figure below shows the path of public spending since the late 1990s, as well as official forecasts for beyond the next election given the current coalition government’s plans. Over this Parliament, headline spending hasn't changed by all that much in real terms (it is forecast to be cut by 2.9% between 2010–11 and 2014–15). However, since the economy has grown, spending as a share of national income has fallen, so that by 2014–15 it is forecast to be around four percentage points below its 2010–11 level (40.7% down from 44.8%).
Within the total, spending on some areas has been increasing in real terms. Despite measures that have reduced the generosity of the benefit and tax credit system (see Benefits), real spending on social security and tax credits is forecast to increase by 2.8% over this parliament, driven largely by an increase in state pension spending of 15.3%. Alongside this, departmental spending has been cut by a cumulative 9.2% over this parliament. A further cut of 0.6% has been announced and allocated for 2015-16.
Figure 1. Total public spending [get the data for this graph]
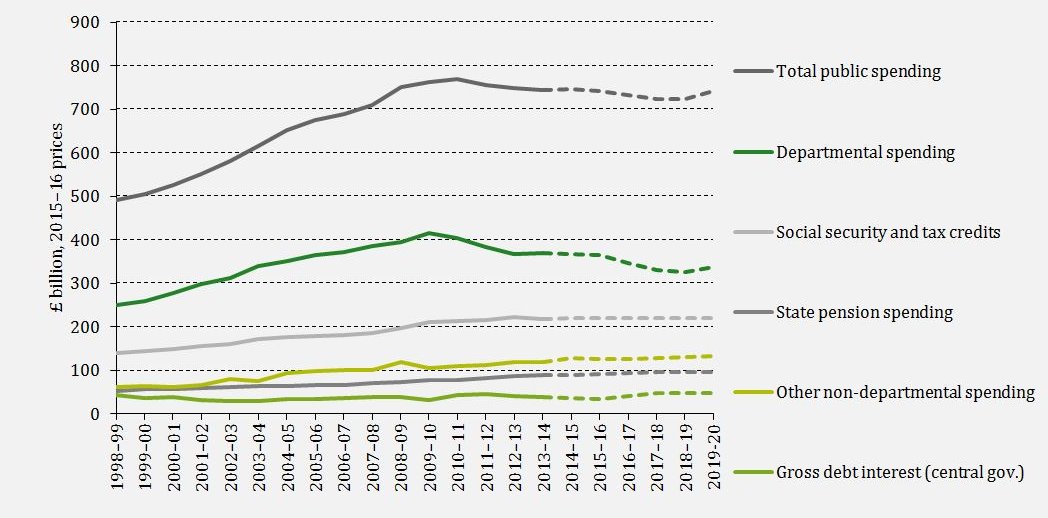
Source: Forecasts are from OBR Economic and Fiscal Outlook December 2014 and DWP Benefit Expenditure Tables. Out-turn data are from ONS (total public spending (series KX5Q) and central government gross debt interest (series NMFX)), DWP Benefit Expenditure Tables (social security and tax credits), and HM Treasury, Public Expenditure Statistical Analyses (various years) (Departmental spending).
Spending on public services: 2010–11 to 2015–16
The cut to departmental spending between 2010-11 and 2014-15 has differed from that originally planned in the 2010 Spending Review. Non-investment spending has been cut more than originally intended in cash terms, but inflation has turned out lower than forecast so it has still been cut less than originally expected in real terms (7.8% compared with 8.3%). Real investment spending cuts have turned out much lower than originally planned (13.6% rather than 25.9%) due to lower-than-forecast inflation and decisions since 2010 to top up these spending plans.
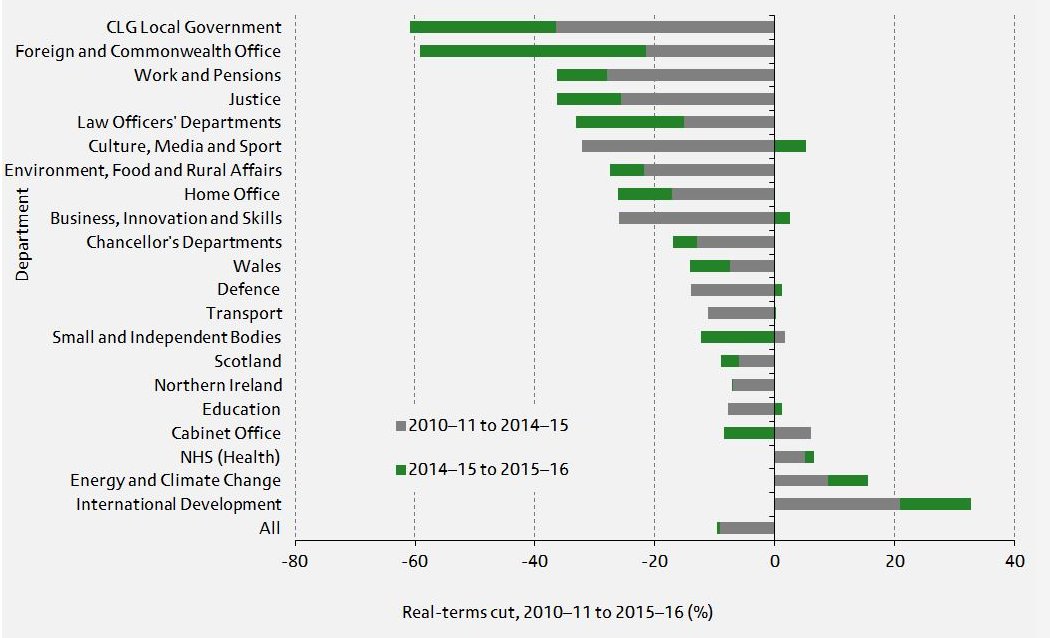
The cuts to departmental spending have been allocated between departments as far as 2015–16. They have not been shared equally: protection from budget cuts for the NHS, schools and aid spending has concentrated the cuts on to the other, unprotected departments. This has increased the proportion of spending devoted to these protected areas, from around 39% in 2010–11 to around 47% by 2015–16. And whereas overall departmental spending will have been cut by 9.5%, the average cuts for unprotected departments will have been much higher, at 20.6%. The graph below shows how individual government departments will have fared.
Figure 2. Distribution of real spending cuts across departments [get the data for this graph]
Spending on public services: beyond 2015–16
Beyond 2015–16, the coalition government has pencilled in further real terms cuts to total public spending through to 2017–18, then a real freeze up to 2018–19, and then a real terms increase in 2019–20. This profile would take spending in 2019–20 to around the same share of spending as it was in 2000–01. Given OBR forecasts for non-departmental spending, these plans for total spending imply departmental spending would be cut by a further 7.2% between 2015–16 and 2019–20.
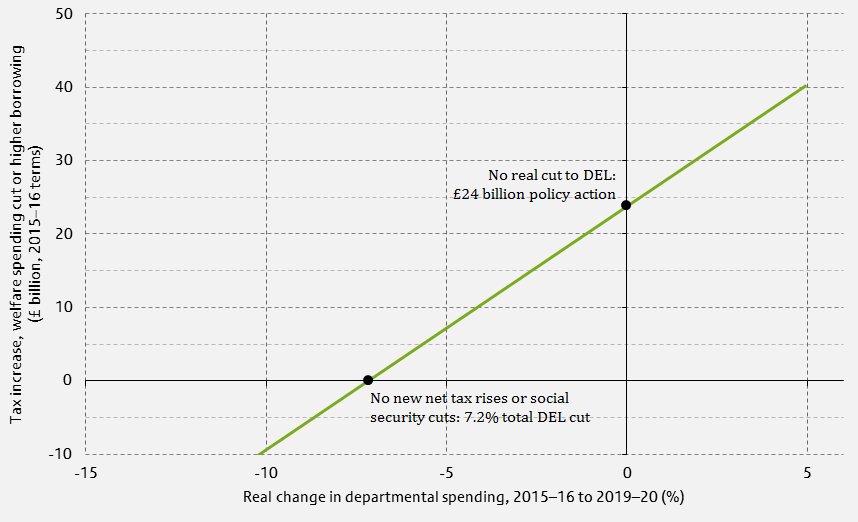
However, departments’ budgets have not been set for years beyond 2015–16, and whoever is in power after the election may want to choose a different path for the overall level of public spending. Figure 3 illustrates how tax increases, welfare spending cuts or increases in borrowing (relative to current legislated policy and forecasts based on that) could be traded-off against further cuts to departmental spending. Assuming all the consolidation implied by the 2014 Autumn Statement happens through reductions in departmental spending, this area is projected to be cut by 14.1% between 2015–16 and 2019–20. Alternatively if a future government wanted to avoid any further cut to real departmental spending, £24 billion of tax increases, welfare cuts or higher borrowing would be required. This chapter of the 2015 Green Budget explores in more detail the options for public service spending after the election.
The three main UK parties have announced different fiscal targets, all of which could allow smaller cuts to departmental spending than are implied by the coalition government’s plan. And assuming no changes to tax, the fiscal rules of Labour and the Liberal Democrats could allow for substantially more spending than the Conservatives. This is because these two parties would allow some borrowing for investment, unlike the Conservatives who are targeting overall budget balance. A fuller comparison of the parties' proposals, and an illustration of the trade-off between departmental spending and tax increases or other spending cuts given each of their fiscal rules, is available in this election briefing note.
Figure 3. Trade-off between tax increases or further benefit cuts and smaller cuts to departmental spending (assuming no change in borrowing) [get the data for this graph]
IFS election 2015 publications
Briefing notes
Daniel Chandler and Richard Disney, 'Extending Right to Buy: risks and uncertainties', Institute for Fiscal Studies: 24 April 2015, IFS briefing note BN171, election briefing note 2015 No. 12, ISBN: 978-1-909463-89-9
Rowena Crawford, Carl Emmerson, Soumaya Keynes and Gemma Tetlow, 'Post-election austerity: parties' plans compared', Institute for Fiscal Studies: 23 April 2015, IFS briefing note BN170, election briefing note 2015 No. 11, ISBN: 978-1-909463-882
David Innes and Gemma Tetlow, 'Central cuts, local decision-making: changes in local government spending and revenues in England, 2009-10 to 2014-15', Institute for Fiscal Studies: 6 March 2015, IFS briefing note BN166, election briefing note 2015 No. 8, ISBN: 978-1-909463-81-3
Andrew Hood and David Phillips, 'Benefit spending and reforms: the coalition government's record', Institute for Fiscal Studies: 28 January 2015, IFS briefing note BN160, election briefing note 2015 No. 3, ISBN: 978-1-909463-74-5
Rowena Crawford, Carl Emmerson, Soumaya Keynes and Gemma Tetlow, 'Fiscal aims and austerity: the parties’ plans compared', Institute for Fiscal Studies: 19 December 2014, IFS briefing note BN158, election briefing note 2015 No. 1, ISBN: 978-1-978-1-909463-72-1
The 2015 IFS Green Budget
Rowena Crawford and Soumaya Keynes, Options for further departmental spending cuts, The 2015 IFS Green Budget, Carl Emmerson, Paul Johnson and Robert Joyce (eds.), February 2015
Rowena Crawford and George Stoye, Challenges for health spending, The 2015 IFS Green Budget, Carl Emmerson, Paul Johnson and Robert Joyce (eds.), February 2015
Observations
David Phillips, Full fiscal autonomy delayed? The SNP's plans for further devolution to Scotland, Institute for Fiscal Studies: 21 April 2015, Observation
David Phillips, Health spending protected by more in England, but social services spending protected more in Wales, Institute for Fiscal Studies: 18 February 2015, Observation
Andrew Hood and David Phillips, Substantial cuts made, but biggest changes to the benefit system yet to come, Institute for Fiscal Studies: 28 January 2015, Observation
Useful resources
A presentation given at the IFS Budget briefing 2015 summarised the outlook for public services spending in the light of plans announced in the Budget.
Long-run data on public spending by function (e.g. health, education) is available here.
This report analyses in depth the changes to public spending since 1948.
This report analyses long-term trends and recent changes in social security spending.
This chapter from the 2014 Green Budget analyses risks to the government’s spending plans.