

Schools
School funding in England – relative protection to date, cuts expected in the next parliament
Since 2010, school spending in England has been protected from spending cuts. However, the introduction of the pupil premium means that more deprived schools have seen larger increases in funding than less deprived ones, making the school funding system more redistributive than it was in 2010. The school funding system in England has also been subject to some welcome simplification. Over the next parliament, there are likely to be real-terms cuts to school spending per pupil in England. Although the commitments made by the three main UK parties are subtly different, they could all imply real spending per pupil falling by 7% or more between 2014-15 and 2019-20.
Changes in school spending under the coalition government
The table below shows how the different elements of the Department for Education’s (DfE) budget have evolved over this parliament (2010–11 to 2014–15). Current or day-to-day spending on schools in England has been relatively protected from spending cuts. The overall schools budget has increased by 3.0% in real terms between 2010–11 and 2014–15. With pupil numbers growing by about 2.4% over the period, this represents a small increase in real spending per pupil of about 0.6%. This occurred despite a decision only to protect the main schools grant per pupil in cash terms. Overall, this was more than compensated for by the introduction of the pupil premium, spending on which reached £2.3 billion in 2014–15.
This compares with a real-terms cut of 13.6% to the age 16–19 education budget and a large real-terms cut to capital spending (across all phases of education) of about one-third.
In contrast, the early years budget has seen a large real-terms increase of nearly 40% over this parliament, reflecting the increased generosity of the entitlement to free nursery for 3 and 4 year olds (extended from 12.5 to 15 hours in September 2010 and to disadvantaged 2 year olds from September 2013). However, these figures do not account for the 40% real-terms cut to the Early Intervention Grant (now part of the overall local government settlement). The Early Intervention Grant is intended to cover spending on specific services such as Sure Start Children’s Centres.
Department for Education (England) spending plans, 2010–11 to 2014–15 (2015–16 prices)
|
|
2010–11 |
2014–15 |
% total change (real terms) |
% annual average |
|
(£bn, 2015-16 prices) |
||||
| DfE total DEL |
62.6 |
59.3 |
-5.3% |
-1.4% |
| DfE capital DEL |
7.8 |
5.1 |
-34.3% |
-10.0% |
| DfE resource DEL |
54.8 |
54.2 |
-1.2% |
-0.3% |
| Of which: |
|
|
||
| Early years budget |
2.1 |
2.9 |
39.1% |
8.6% |
| Schools budget (ages 5-16) |
37.5 |
38.6 |
3.0% |
0.7% |
| 16-19 education budget |
8.8 |
7.6 |
-13.6% |
-3.6% |
Source: Sibieta, L. (2015), Schools spending, IFS Briefing note 168.
The coalition government has also made a number of important reforms to the school funding system in England, including: the introduction of the pupil premium; simpler school funding formulae, which help ensure local authority maintained schools, academies and free schools are funded on a similar basis; and giving schools more financial autonomy and responsibility.
Even before the pupil premium, there was already a substantial level of funding targeted at deprivation. In 2010–11, funding per pupil was 35% higher amongst the most deprived set of primary schools than amongst the least deprived ones, and it was 41% higher amongst the most deprived secondary schools than amongst the least deprived. By 2014–15, these figures had increased to about 42% and 49%, respectively, as funding per pupil rose more strongly amongst more deprived schools as a result of the pupil premium.
As well as a relatively generous settlement in the current parliament, squeezes on public sector pay mean that the actual costs faced by schools are likely to have increased by less than overall measures of economy-wide inflation. This is probably an important explanation for why the school workforce has not fallen since 2010. The number of teachers has held steady at 450,000 and the number of teaching assistants has actually increased from 210,000 in 2010 to reach 240,000 by 2013.
Schools spending over the next parliament
There are likely to be some significant cost pressures on schools’ spending over the next parliament. First, the pupil population is rapidly expanding. To date, the primary school population has grown by about 8% between 2010 and 2014, whilst the secondary school population has fallen by about 4%, leading to a net increase of 2.4% (see Figure below). Between 2016 and 2020, we expect to see a rise in both the primary school population (of 5%) and the secondary school population (10%), leading to a net expected rise of 7% in the school population. This growth in pupil numbers will place pressure on both the current budget and the capital budget (the latter is already planned to be cut by over 40% between 2010–11 and 2015–16). This growth is expected to be largest in London.
Figure 1. Actual and forecast pupil numbers at state-funded schools January 2008 to January 2020
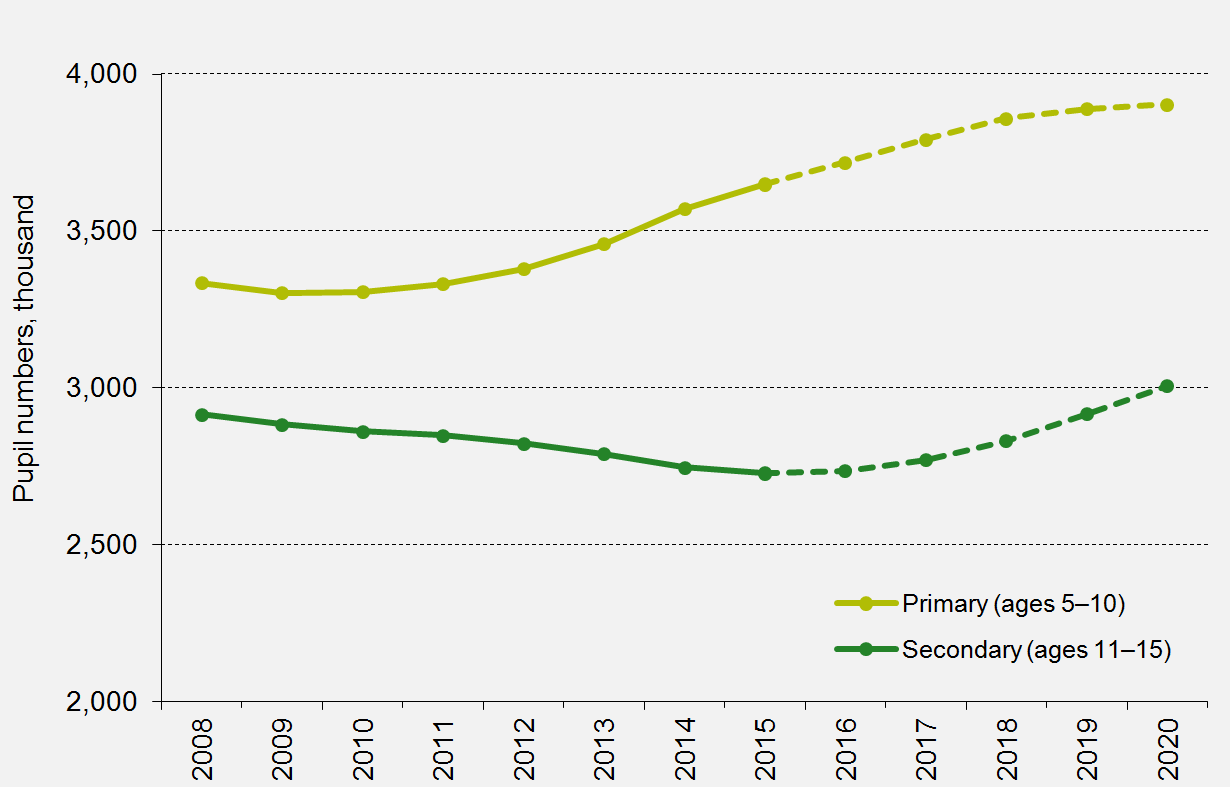
Note: Data and projections are for January each year. Age is at the start of the academic year. Dashed lines denote forecast years.
Source: Department for Education, ‘National pupil projections: trends in pupil numbers, 2014, https://www.gov.uk/government/statistics/national-pupil-projections-trends-in-pupil-numbers-july-2014.
Second, the cost of employing staff for schools is likely to rise. There will be upward pressure on public sector pay levels in the next few years if private sector earnings continue to recover. The Office for Budget Responsibility (OBR) currently expects public sector pay per head to rise by 14.2% between 2014–15 and 2019–20. Additional employer pension contributions and higher National Insurance contributions (due to the end of contracting out) will further push up costs.
Labour and the Liberal Democrats have committed to protecting the age 3–19 education budget in real terms, though neither have said how this will be split across different parts of the budget. Meanwhile, the Conservatives have committed to protecting cash school spending per pupil. In practice, these commitments might imply similar overall settlements for schools if nominal spending increases are allocated equally across all areas by Labour and the Liberal Democrats (and assuming the protections are only just met). However, all could imply real-terms cuts to school spending per pupil of 7% between 2015–16 and 2019–20. This increases to 9% if we account for increases in National Insurance and pension contributions and to 12% if we also account for the OBR’s assumption for likely growth in public sector earnings. This would be less generous than the real-terms increase in spending per pupil seen over the current parliament.
There appears to be a bigger difference between the parties in terms of other elements of education spending. Both Labour and the Liberal Democrats have committed to protecting the entire 3–19 education budget. Depending on how this is allocated across areas, this could be more generous for 16–19 education than the real-terms cuts seen in the current parliament. It could also allow schools spending to increase in real terms (if these other areas see below-real-terms increases). The Conservatives have not made any commitments for education spending outside of the schools budget.
Useful resources
This election briefing note summarises trends in schools spending under the coalition government and compares the commitments made by the three main UK parties.
This briefing note analyses long-run changes in education and schools spending.
This report analyses the potential effects of a national funding formula for schools in England.
This presentation summarises the school spending settlement in the 2013 Spending Round schools.