


This Observation comes from an article published in a special edition of Fiscal Studies, based on IFS analysis for the 2015 general election. The articles in this special issue are currently available free of charge in the Wiley online library. With this piece of work, we conclude the analysis on our general election website.
Looking back
By any standards, the fiscal task facing the Conservative–Liberal-Democrat coalition government when it assumed office in May 2010 was a remarkable one. The UK had just experienced its deepest recession in almost a century and the deficit was at its highest point since the Second World War, at just over 10 per cent of national income. The Conservative part of the coalition had been elected on a platform of quite aggressive deficit reduction, which would require historically unprecedented spending cuts alongside at least some tax rises. In the event, the coalition agreement largely accepted the Conservative plans to reach structural current budget balance by the end of the parliament.
As things turned out, poorer-than-expected economic growth put paid to that ambition. Between 2010 and 2012, the outlook for economic growth and tax revenues deteriorated. The government did not respond to the bigger-than-originally-predicted deficit by imposing greater spending cuts or tax increases by the end of the parliament; rather, it promised further fiscal consolidation after the 2015 election.[1] The result was that, even after the tightest period for public spending in 60 years, by the end of 2014–15 the deficit still stood at about 5 per cent of national income.
The deficit reduction achieved over the parliament was still sizeable, however, and required some very substantial spending cuts as well as some net tax increases. Figure 1 shows how this deficit reduction was achieved, in terms of changes to tax and public spending as shares of national income, along with the new Conservative government’s plans for these through to 2019–20.[2] The large majority of the fiscal consolidation occurred through reducing spending as a proportion of national income, from nearly 46 per cent in 2009–10 to just over 40 per cent by 2014–15. Under the Conservatives’ plans, reductions in public spending as a share of national income will continue until 2018–19, when spending is forecast to reach around 36 per cent of national income – around the share it was in 1999−2000. In the absence of the fiscal consolidation, public spending would have remained around 45 per cent of national income.
Figure 1: Taxes and spending as a share of national income, with and without fiscal consolidation
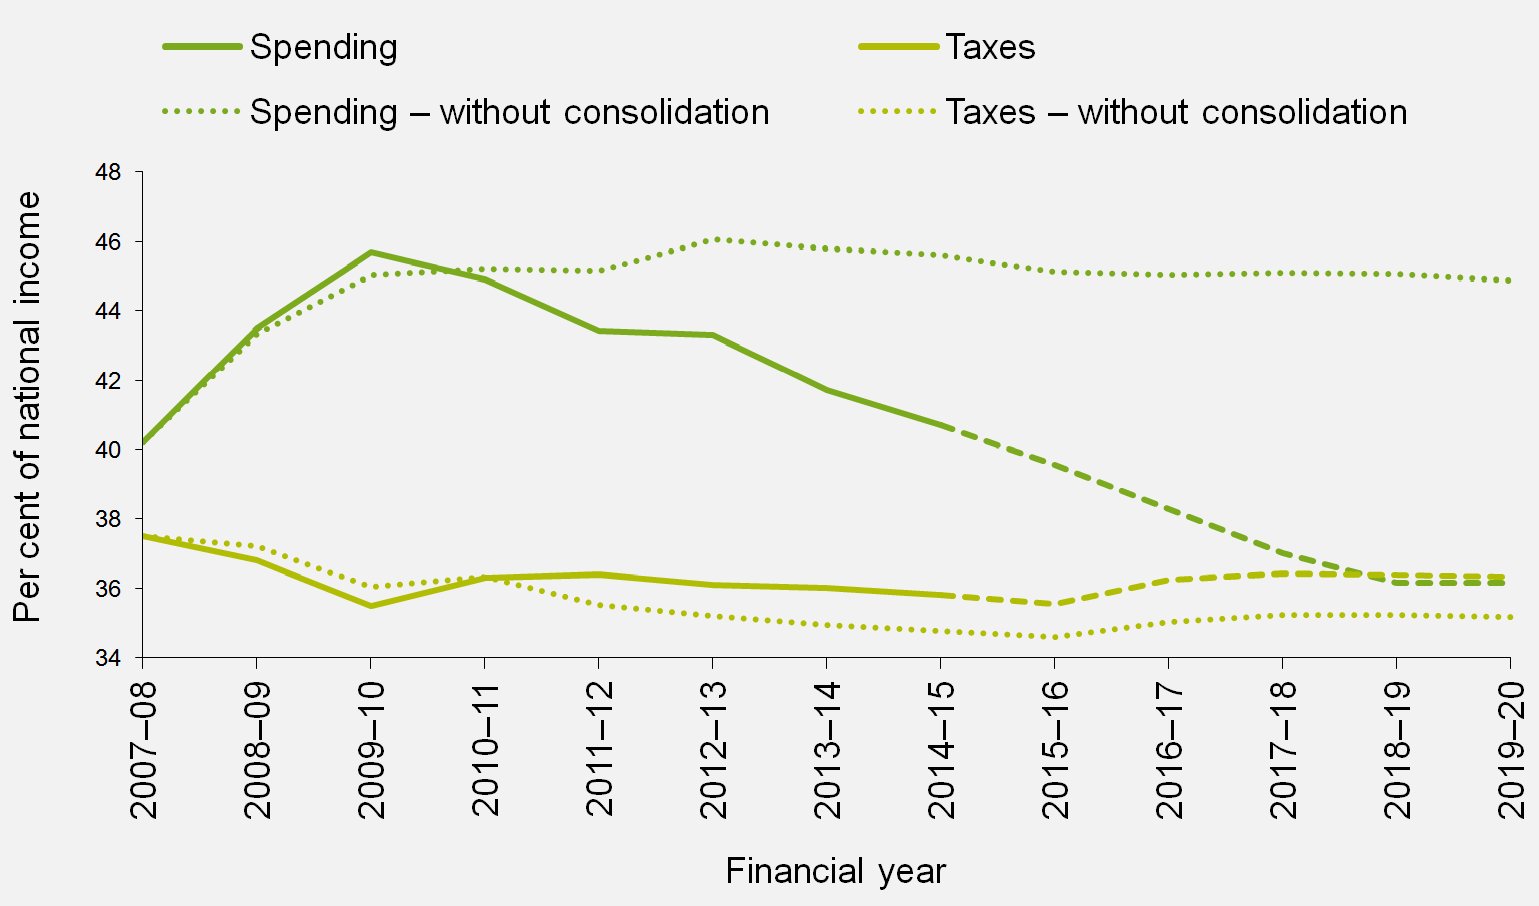
Note: ‘Without consolidation’ lines ignore the impact of all fiscal policy measures that have been announced in fiscal events since March 2008. Dashed lines indicate the plans of the incoming Conservative government in 2015 based on its manifesto commitments.
Source: Authors’ calculations based on Office for Budget Responsibility (2015a), Conservatives (2015) and all fiscal events between March 2008 and March 2015.
The big fall in spending as a proportion of national income shown in Figure 1 corresponds to a cut in real, price-adjusted, terms to total public spending of ‘only’ around 3 per cent between 2010–11 and 2014–15. Of course, what happened was much more complex than simply cutting all spending by similar amounts. Departmental spending – that is, spending on public services such as health, education, defence and so on – fell by 9 per cent, while non-departmental spending – such as debt interest payments, spending on social security and spending by local authorities financed by locally-raised revenues – actually rose by 4 per cent over the period.
Nor were the cuts to departmental spending shared equally across service areas. Notably, spending on health, schools and overseas aid were protected, increasing by 5 per cent, 3 per cent and 31 per cent respectively in real terms between 2010−11 and 2014–15. Together these areas amounted to nearly 40 per cent of all departmental spending in 2010–11, and so their protection increased the average cut to other areas of departmental spending to 19 per cent rather than 9 per cent.[3]
Two papers in this Special Issue focus on what happened to specific elements of departmental spending. Luke Sibieta looks at changes to school spending. While spending on schools may not have changed dramatically over this period – the 3 per cent real increase slightly more than kept pace with rising pupil numbers over the period – there were important reforms to the school funding system. Sibieta describes these reforms and explores the implications for the distribution of school funding, showing in particular how funding became more focused on schools with the poorest intakes.
Meanwhile, David Innes and Gemma Tetlow look at changes to local government spending. They show how local authorities to some extent mirrored the behaviour of central government in protecting some areas of spending at the expense of others. In particular, spending on social care – the biggest element of spending under local control – was cut significantly less than the average. The authors also show how, by contrast with what happened to school funding, it was local authorities with the greatest needs, which had been most reliant on central government funding, that experienced the sharpest cuts in spending.
At the same time as these significant cuts in public service spending were introduced, some substantial reforms were implemented – for example, in the funding of schools and hospitals – or planned – as in the (delayed) introduction of universal credit, a plan to roll six out-of-work benefits into one single payment. When eventually implemented, the introduction of universal credit will represent one of the biggest reforms to the benefits system in many decades.[4]
Figure 1 shows that, in contrast to the substantial reductions in public spending that occurred between 2010–11 and 2014–15, taxes as a share of national income remained relatively stable over the last parliament, hovering at around 36 per cent of national income. While the direct impact of tax changes implemented by the coalition reduced borrowing only slightly, by £16.4 billion in 2015–16, this was the net effect of £64.3 billion of tax rises and £48.0 billion of tax cuts. So even if the net effect of tax changes was relatively modest, there was considerable policy activism. That policy activism, however, led to relatively little in the way of substantive reform other than in the taxation of profits through corporation tax and in the taxation of savings.
As Helen Miller and Thomas Pope in this Special Issue show in some detail, the coalition enacted a series of changes to corporation tax, with the explicit, and fulfilled, aim of increasing the competitiveness of the UK corporate tax system. The net cost of the package of onshore measures is almost £8 billion in 2015–16, equivalent to 16.5 per cent of real pre-crisis (2007–08) onshore corporation tax receipts.[5] Only increases in the income tax personal allowance – the amount of income that can be taken before an individual becomes liable for any income tax – represent a bigger giveaway in revenue terms than cutting the main corporation tax rate by 8 percentage points from 28 per cent to 20 per cent.[6]
Stuart Adam and Barra Roantree explore the coalition government’s policies on non-corporate taxes and argue that only in the taxation of pensions and savings were there important structural changes. Other changes to the tax system have been fiscally and distributionally significant, but none has resulted in real structural change or improvement, with most focusing on changing rates and thresholds.
These changes to the tax system were implemented alongside cuts to social security benefits. Hood and Phillips (2015) show that reforms implemented by the coalition will result in benefit spending in 2015–16 being £16.7 billion less than it would have been in the absence of any policy change. However, different groups have been differentially affected by these changes, with increases for pensioners more than compensated for by reductions in the generosity of working-age benefits.
Stuart Adam, James Browne and William Elming in this Special Issue provide a detailed analysis of the distributional consequences of the tax and benefit policies implemented by the coalition. Broadly speaking, they show that the overall effect of these changes was to take money from those with the highest incomes, and those dependent on benefits in the bottom half of the distribution, whilst largely protecting those in the middle and upper-middle parts of the income distribution.
Changes in the labour market were, in fact, more important determinants of the overall path of living standards for most than were tax and benefit changes. Cribb and Joyce (2015) show that real wages fell significantly after 2009, and Cribb, Hood and Joyce (2015) estimate that real median household incomes in 2014–15 were at about their 2007–08 (pre-crisis) level and still something like 2 per cent below their 2009–10 peak. This represents an extremely unusual period historically, with wages and incomes recovering much more slowly than is usual coming out of a recession.
Looking forward
The newly-elected Conservative government has entered office with a deficit of 5 per cent of national income and a commitment to substantial additional spending cuts. If implemented, they will take public spending as a fraction of national income back to the level it was at the end of the 1990s, and close to its lowest level since the Second World War.
Without doubt, implementing those additional cuts will be challenging. The Conservative government has pledged a £12 billion, or roughly 10 per cent, reduction in spending on (non-pension) social security benefits. If cut to this extent, spending on social security (excluding pensions) will fall to its lowest level as a share of national income since 1990. Even then, departmental spending would need to be cut by a further 7 per cent between 2014–15 and 2018–19 for the deficit to be eliminated as planned. Given the Conservatives’ pledges to increase health spending, protect school spending and increase overseas aid spending, other ‘unprotected’ areas of spending are looking at further cuts of around 15 per cent over this period. This would result in real-terms spending on ‘unprotected’ departments having fallen by around a third on average between 2010–11 and 2018–19.
It is this concentration of spending cuts in particular areas, rather than the overall level of cuts to total public spending, which is most important. The composition of the state is changing, with public spending ever more focused on providing health services and pensions.[7]
Looking further forward, the continued ageing of the UK population will put increased pressures on spending. On rather conservative assumptions about the likely path for health spending, the Office for Budget Responsibility (OBR)’s central projection is that spending on state pensions, health and social care will rise by 5 per cent of national income between 2018–19 and 2053–54.[8] This necessarily implies more taxes, more borrowing or less spending elsewhere to the tune of 5 per cent of national income each year. However, borrowing an additional 5 per cent of national income each year is not really an option, as the OBR illustrates that this would push public sector net debt onto an unsustainable increasing trajectory.
The future challenges are not just about reducing spending or increasing taxes though, but also about reforming public services and the tax and benefit system and making choices about the distributional consequences of any changes. For example, the National Health Service faces increasing demand from the growing and ageing population, and cost pressures from wages and high-cost drugs. The service therefore faces a considerable productivity challenge in order to ensure that service levels or quality do not fall, despite the real increase in funding that has been proposed over the next parliament.[9] Other challenges include issues ranging from the allocation of resources and use of consistent formulae, as with school and local authority spending,[10] to the extent and design of private co-payments in areas such as higher education and social care. These decisions all have distributional consequences. For example, since 2010, changes to school funding have benefited schools with poorer intakes, whilst changes to local authority funding have hit poorer areas harder. Changes in higher education financing have been rather progressive.[11]
Distributional issues are much more salient when it comes to social security spending. If the new Conservative government’s pledged £12 billion of cuts are delivered, they will almost certainly hit those on low incomes – most benefits (other than pensions) are means tested and are only received by the relatively poor. Structural reforms, such as the introduction of universal credit, might improve efficiency and will have more complex distributional effects. Even leaving aside the implementation of these planned reforms, numerous challenges still remain. There are some indexation arrangements in place that make little sense in the long run. For example, the continuation of the ‘triple lock’ for pensions – whereby the basic state pension is increased by the highest of CPI inflation, earnings growth and 2.5 per cent – will be increasingly costly and must surely be reviewed at some point, while the indexation of housing benefit means that relative benefit levels across the country in future will depend on relative rent levels back in 2012. There are some existing policies that are proving difficult to implement, such as the new (tighter) eligibility criteria for disability benefits. And there are some benefits on which spending continues to rise, despite cuts to generosity (for example, housing benefit, where increased spending is being driven by the growth of the private rental sector and the growth in private rents).
Between 2010 and 2015, cuts in welfare spending were accompanied by some very sharp tax increases for the richest, but also by a package of tax measures that ensured that those in the middle to upper-middle parts of the income distribution were protected. On the whole, though, there was little sign of coherent tax reform. The biggest reforms affected the taxation of pensions and savings, but even here many of the pension tax changes reduced the coherence of the tax system.
Going forward, the Conservative government is committed to reducing the coherence of pension taxation even further by tapering away tax relief for higher earners, thereby introducing a very high effective marginal income tax rate for some. It is also, bizarrely, committed to legislating to prevent itself from raising rates of income tax, National Insurance and VAT as well as to introducing tax breaks for owner-occupied housing into the inheritance tax system.
The need for more coherent tax reform is becoming urgent, and none of these proposals moves in an appropriate direction. A number of recent changes have also introduced anomalies into the structure of income tax[12] and, as Adam and Roantree in this Special Issue note, there are now several important thresholds in the income tax system that are fixed in nominal terms. As for the big structural problems in the tax system, no attempt has been made to integrate income tax with National Insurance contributions, with the latter acting simply as a second tax on earnings. The system of housing taxation is becoming increasingly inefficient and damaging. We continue to have one of the narrowest VAT bases in the OECD. The scope for improvement is considerable. As Adam and Roantree conclude:
Having failed to implement substantive structural reform, the coalition has left its successor with numerous challenges to address the long-standing weaknesses in the tax system identified by [the Mirrlees Review[13]] – some of which (such as increasingly unsustainable council tax valuations and ill-targeted fuel duties) are becoming ever more pressing.
Notes
[1]More detail on the evolution of the government’s public finance plans over this period is provided by Emmerson and Tetlow (2015).
[2]These plans are taken from the Conservative Party manifesto (Conservatives, 2015), which is the latest available information at the time of writing.
[3]Further detail on the extent of differences between departments in the scale of the cuts they suffered is provided by Crawford and Keynes (2015).
[4]See Hood and Oakley (2014) for a description of universal credit.
[5]‘Onshore’ revenues are essentially those not associated with the taxation of North Sea oil and gas.
[6]The personal allowance has been increased to £10,600 in 2015–16, £2,835 higher than the £7,765 it would have been if the 2010–11 allowance had simply been uprated in line with RPI inflation (used by default for uprating at the time).
[7]As noted by Crawford and Johnson (2011) and Crawford and Keynes (2015).
[8]Office for Budget Responsibility, 2015b.
[9]Crawford and Stoye, 2015.
[10]As highlighted respectively by Sibieta and by Innes and Tetlow in this Special Issue.
[11]See Crawford and Jin (2014) for a discussion.
[12]Discussed in more detail in Johnson (2014).
[13]Mirrlees et al., 2011.
References
Conservatives (2015), The Conservative Party Manifesto 2015.
Crawford, C. and Jin, W. (2014), Payback Time? Student Debt and Loan Repayments: What Will the 2012 Reforms Mean for Graduates?, Report no. R93, London: Institute for Fiscal Studies.
Crawford, R. and Johnson, P. (2011), The changing composition of public spending, Institute for Fiscal Studies, Briefing Note no. BN119.
— and Keynes, S. (2015), Options for further departmental spending cuts, in C. Emmerson, P. Johnson and R. Joyce (eds), The IFS Green Budget: February 2015, London: Institute for Fiscal Studies.
— and Stoye, G. (2015), ‘The outlook for public spending on the National Health Service’, The Lancet, vol. 385, pp. 1155–6.
Cribb, J., Hood, A. and Joyce, R. (2015), Living standards: recent trends and future challenges, Institute for Fiscal Studies, Briefing Note no. BN165 .
— and Joyce, R. (2015), Earnings since the recession, in C. Emmerson, P. Johnson and R. Joyce (eds), The IFS Green Budget: February 2015, London: Institute for Fiscal Studies.
Emmerson, C. and Tetlow, G. (2015), Public finances under the coalition, in C. Emmerson, P. Johnson and R. Joyce (eds), The IFS Green Budget: February 2015, London: Institute for Fiscal Studies.
Hood, A. and Oakley, L. (2014), A survey of the GB benefit system, Institute for Fiscal Studies, Briefing Note no. BN130.
— and Phillips, D. (2015), Benefit spending and reforms: the coalition government’s record, Institute for Fiscal Studies, Briefing Note no. BN160.
Johnson, P. (2014), ‘Tax without design: recent developments in UK tax policy’, Fiscal Studies, vol. 35, pp. 243–73.
Mirrlees, J., Adam, S., Besley, T., Blundell, R., Bond, S., Chote, R., Gammie, M., Johnson, P., Myles, G. and Poterba, J. (2011), Tax by Design: The Mirrlees Review, Oxford: Oxford University Press for the Institute for Fiscal Studies.