

Higher Education Funding
Reforms to student finances will have complex and far-reaching effects
The coalition government has overseen significant changes to Higher Education (HE) funding. Most notably, the cap on undergraduate tuition fees was increased to £9,000 per year in October 2012, alongside substantial reductions to teaching grants and other reforms to the system. These reforms were intended to shift the burden of payments away from the taxpayer and towards graduates. However, more universities than expected charged the maximum £9,000 per year. This, coupled with a more progressive student loan repayment system and lower graduate earnings growth, means that the cost to the taxpayer is unlikely to fall as much as might have been hoped: our current estimates suggest that in the long run the government might reduce spending on higher education by as little as 5% as a result of this massive shake-up. The biggest winners have been universities, who have seen a substantial increase in funding for teaching undergraduates, on average, as a result of the reform.
HE funding works as follows: universities receive grants to cover the cost of teaching undergraduates directly from the government and tuition fees from students. Students receive loans from the government to cover tuition and living costs, which they pay back - conditional on income - once they leave university.
The 2012 reforms increased the level of tuition fees, but reduced teaching grants. This shift has significant implications for the public finances. First, certain spending in the form of teaching grants has been replaced by uncertain spending in the form of loan subsidies, the magnitude of which will depend on student loan repayments and won’t be known for decades to come. Second, the new system increases public debt, but reduces public spending (as the expected future loan write-off does not count towards current spending). The reforms thus increased university funding by increasing debt but reducing the deficit.
Table 1 summarises the sources and recipients of funding for the pre- and post-2012 systems. Because universities increased tuition fees by more than the government expected, overall funding per student over the duration of their course increased by around 16% as a result of the reforms, from £40,922 to £47,435 in 2014 prices, most of which went straight to universities.
While overall funding has increased, however, the taxpayer contribution has fallen. Yet the extent of the fall is uncertain, as it depends on estimates of student loan repayments which will be made in the future. This is, of course, highly uncertain and depends crucially on what happens to graduate earnings over the next 30 years. The rest of the tab is being picked up by graduates, whose contributions to the costs of their education are expected to have increased by more than 50% as a result of the reform. This is mostly because of the huge increase in the amount they borrow (and may thus have to pay back), but is also partly a result of changes that have been made to the terms under which student loans are issued.
Table 1. Recipients of HE spending by source (per student over duration of their course, 2014 money*)
|
|
|
2011/12 |
2012/13 |
% Change |
|
|
Upfront government cash outlay |
£40,922 |
£47,435 |
16% |
||
|
|
Expected graduate contribution |
£15,075 |
£22,843 |
52% |
|
|
|
Expected taxpayer contribution |
£25,847 |
£24,592 |
-5% |
|
|
Recipients: |
|
|
|
||
|
Universities |
£22,143 |
£28,250 |
28% |
||
|
|
Teaching grants |
£12,012 |
£2,010 |
-83% |
|
|
|
Tuition fees minus fee waivers |
£11,522 |
£27,299 |
137% |
|
|
|
Fee waivers |
£0 |
-£738 |
|
|
|
|
Bursaries and scholarships |
-£1,391 |
-£1,257 |
10% |
|
|
Students |
£18,779 |
£19,185 |
2% |
||
|
|
Maintenance grants |
£4,741 |
£4,941 |
4% |
|
|
|
Maintenance loans |
£12,647 |
£12,987 |
3% |
|
|
|
Bursaries and scholarships |
£1,391 |
£1,257 |
-10% |
|
*Figures are in 2014 prices, discounted to 2012, using a real discount rate of 2.2%.
Prior to the 2012 reforms, student loan repayments worked as follows: graduates repaid 9% of their income above £17,846 (in 2016 prices) for a maximum of 25 years, and the size of their loan increased in line with inflation. After the reforms, graduates will still have to repay 9% of their income above a repayment threshold, but that threshold has risen to £21,000 (in 2016 prices) and repayments have to be made for up to 30 years. Students are also charged a real interest rate of 3% (i.e. 3% above inflation) while they are studying, and between 0% and 3% once they are liable for repayments, with the rate rising linearly with income.
These reforms mean that graduates with incomes of between £17,846 and £21,000 per year (in 2016 prices) would have been liable for repayments under the old system but not the new one, thus reducing total repayments. At the same time, the higher interest rate charged and the longer repayment period are both likely to increase total repayments, other things being equal.
Overall, these changes mean that students leave university with much more debt than under the previous system and also, on average, tend to repay significantly more: we estimate that they would have repaid £15,075 in today’s money, on average, under the old system, compared to £22,843 in today’s money, on average, under the new system.
These amounts vary considerably across the distribution of graduate lifetime earnings. Figure 1 splits graduates into ten equally-sized groups (deciles) on the basis of graduate lifetime earnings and shows their expected repayments in today’s money (the bars; left-hand axis) and as a share of lifetime income (the lines; right-hand axis). It shows that the new system is more progressive than the old system, as the positive relationship between lifetime earnings and repayments has become stronger. Indeed, repayments from the lowest earning graduates will actually be lower under the new system (due to the increased repayment threshold), whilst they are expected to more than double amongst some of the highest earning graduates.
Figure 1. Total NPV real repayments and as a share of real NPV lifetime earnings across distribution of graduate lifetime earnings (2014 prices), by decile [get the data for this graph]
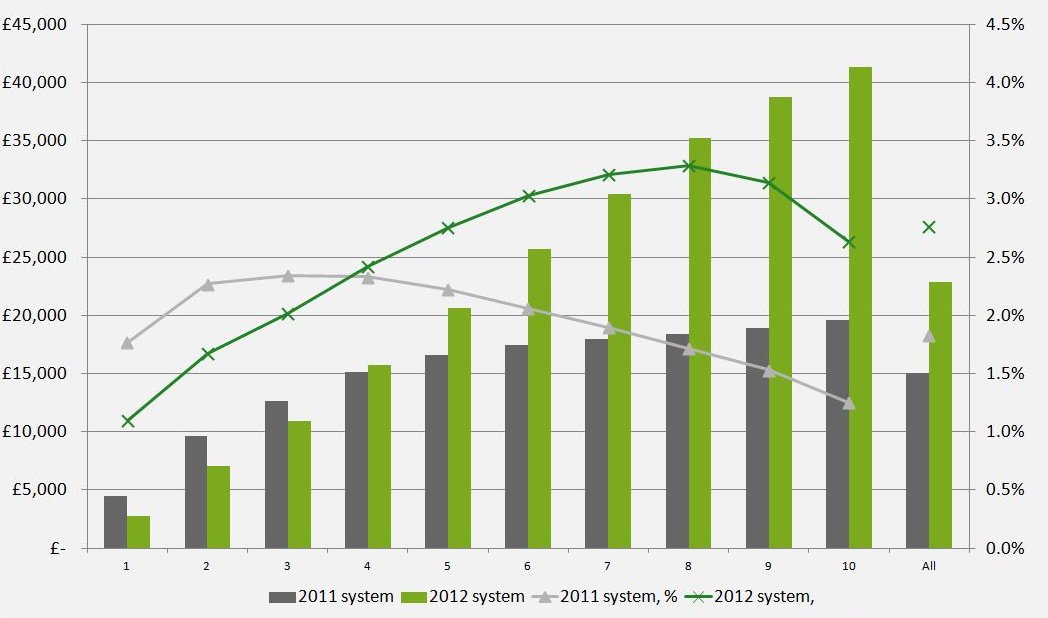
Note: Figures are in 2014 prices, discounted to 2012, using a real discount rate of 2.2%.
While more will be repaid in total, the projected increases in graduate repayments are not as large as the increases in graduate debt, with just one quarter of graduates expected to earn enough to repay their loans in full. Our estimates suggest that for each £1 the government lends English-domiciled students entering university to study full-time for a first degree in 2012, it will incur a cost of 43p; this is equivalent to saying the ‘RAB’ charge for these students is 43%. This has risen from an estimated long-run cost to the government of 38p per £1 under the old system.
A key concern associated with the change in HE funding introduced in 2012 was whether it would put off individuals – especially those from the poorest backgrounds – from going to university. These concerns do not appear to have been realised: the figure below shows the trend in application rates amongst 18 year olds in England split by those from areas with historically high HE participation rates (POLAR Q5) and those from areas with historically low HE participation rates (POLAR Q1). In fact, application rates have risen more quickly amongst those from the lowest participation areas, especially since 2012, which has reduced the gap in participation rates between areas.
Figure 2. % of 18 year olds in England applying for university via UCAS by the main January deadline [get the data for this graph]
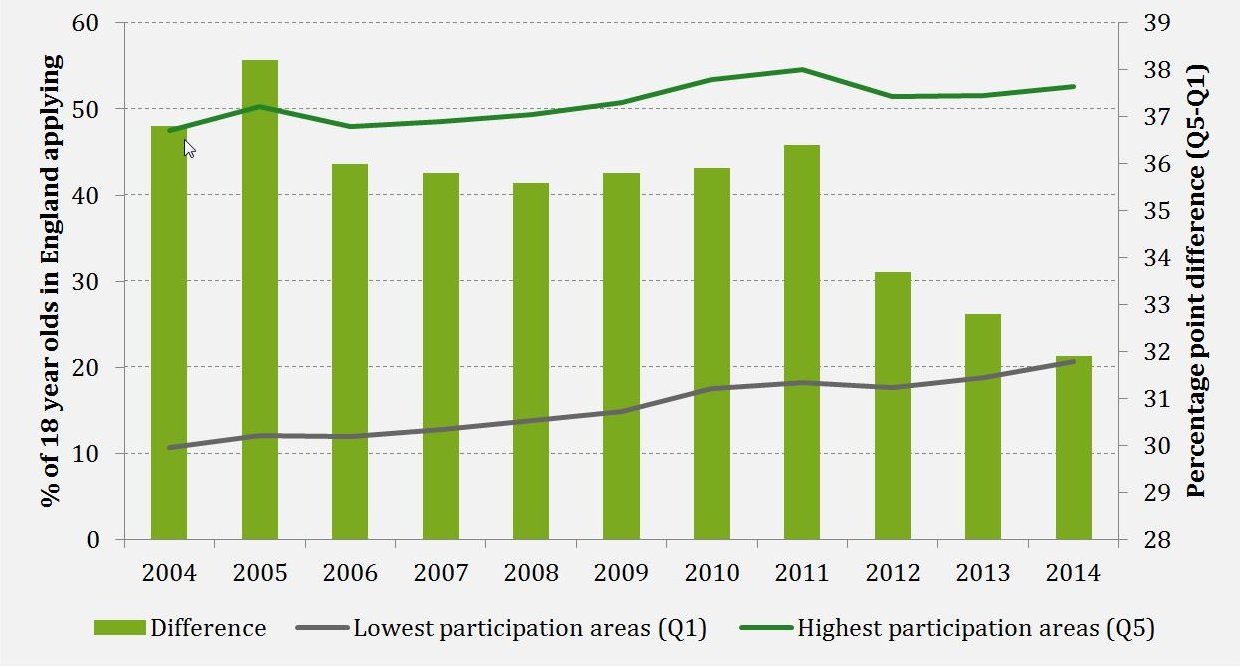
Source: UCAS, 'UK application rates by country, region, sex, age and background', 2014.
The next government is likely to face a number of challenges. First, the removal of the cap on student numbers – to be completed in September 2015 – may test the financial sustainability of the student loan system if the new entrants to university are lower earners, on average, than the existing student population. They may therefore face calls to tweak the parameters of the existing loan system or to take more radical action to combat an increase in the RAB charge. IFS research to be published in March 2015 will explore some of these options.
Second, the government is already facing calls from some universities to increase the cap on tuition fees. If the cap remains frozen in nominal terms at £9,000 per year, then universities will experience a decline in the real resources they have to teach undergraduates, which is only likely to increase these calls. Future governments may have to balance this issue with the increase in the RAB charge that would result from an increase in fees. (In the absence of changes to the parameters of the loan system or higher earnings growth, any increase in fees would necessarily increase the cost of the loan system to the government.)
Third, as well as an increasing focus on the recruitment, retention and performance of undergraduates from lower socio-economic backgrounds, there is also increasing concern over access to postgraduate education amongst these groups. In the 2014 Autumn Statement, the Chancellor announced that loans of up to £10,000 would be available for under 30s studying taught Masters courses from 2016/17. The details of the loan repayment scheme will be subject to consultation, and will be an important driver of whether the government’s intention that the loan system will cost them next to nothing in the long-run will be realised. The next government will need to consider the behavioural responses of individuals and universities, alongside the cost of offering loans, in order to ensure that it achieves the aim of improving access to postgraduate study.
IFS election 2015 publications
Briefing notes
Jack Britton, Claire Crawford, Rowena Crawford and Lorraine Dearden, 'Labour's higher education funding plans', Institute for Fiscal Studies: 27 February 2015, IFS briefing note BN164, election briefing note 2015 No. 6, ISBN: 978-1-909463-83-7
Useful resources
For the two main IFS outputs on H.E. funding issues, see this report for a discussion of the public cost of student loans, and this report summarizing what the 2012 reforms mean for graduates.
See this article for a discussion of the progressivity of the new system.
See this article for a summary of what the reforms have meant for universities.
See this article for a discussion of the concept of a single tipping point for the RAB charge. Also see this 2012 report on student financial support, and a recently updated version here.
This presentation summarises some of the key results on socio-economic differences in HE participation and degree outcomes.
This paper provides more detail on the drivers of socio-economic differences in HE participation. And this report and this paper provide more detail on the drivers of differences in degree outcomes by school characteristics and socio-economic background respectively.
This observation outlines the expected long run cost of the government’s proposed postgraduate loan system and related questions regarding the behavioural responses of individuals and universities.