

Distributional Analysis
Low-income working age households and the very richest have lost the most from tax and benefit changes, with pensioners and upper-middle income groups largely protected
As part of the fiscal consolidation, various reforms have been made to the tax and benefit systems since May 2010, some of which were announced by Labour but introduced by the coalition after May 2010. Here, we examine the effect of all reforms introduced between May 2010 and May 2015, not just those the coalition has announced in its Budgets and Autumn Statements. These changes have reduced household incomes by an average of £1,127 a year, of which we can assign £489 of the revenue raised from tax rises and benefit cuts to particular households.
Most households will have been affected by several of these changes: for example, many households will have benefited from increases to the income tax personal allowance and cuts to fuel duties but lost out from increases in the main rate of VAT and rates of employee National Insurance Contributions and cuts to working age benefits. Accounting for all these changes is necessary to get an accurate picture of which households have gained and lost the most from changes made over the past five years. And as the impact of changes on a particular household will depend on (among other things) their age, family structure, disability status, housing tenure and spending patterns as well as their income, there is no ‘typical’ household that will give a good guide to the average impact of the changes.
In our analysis we therefore calculate how much a representative sample of households have gained or lost overall from the set of changes introduced since May 2010. We do this by comparing total tax liabilities and benefit entitlements under the actual system we expect to be in place in May 2015, to those under an ‘unreformed’ May 2010 system. Thus, we are showing the direct impact of tax and benefit changes on household incomes, ignoring the fact that the economy might have evolved differently and households may have made different decisions (for example, about how much to work) if these changes to the tax and benefit system had not been made. The chart below shows the average gain or loss by household net income group:
Figure 1. Impact of tax and benefit reforms, May 2010 – May 2015 inclusive [get the data for this graph]
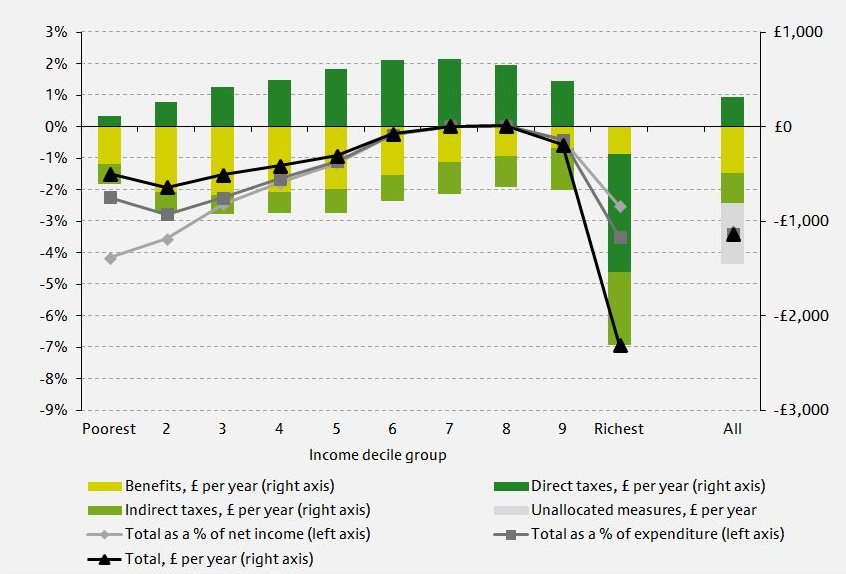
Source: J. Browne and W. Elming (2015), The Effect of the Coalition’s Tax and Benefit Changes on Household Incomes and Work Incentives, IFS Briefing Note 159
Note: Income decile groups are derived by dividing all households into 10 equal-sized groups according to income adjusted for household size using the McClements equivalence scale. Decile group 1 contains the poorest tenth of the population, decile group 2 the second poorest, and so on up to decile group 10, which contains the richest tenth. Assumes full take-up of means-tested benefits and tax credits.
Figure 1 shows that the bottom half of the income distribution have lost out on average as a result of tax and benefit changes during this parliament, mainly due to cuts to benefits and tax credits for those of working age. Furthermore, we can see that upper-middle income groups gained slightly from changes made since May 2010. These groups have benefited the most from increases in the income tax personal allowance, but have been less affected by cuts to benefits than lower income households. This spreadsheet gives the amount of net income required for different household types to be in each of the deciles. The richest lose the most both in cash terms, but not as much as the bottom two deciles as a percentage of income. Unlike the other income decile groups, the richest tenth of households see an increase in direct taxes, mainly as a result of higher NICs rates, restrictions on tax relief on pension contributions, real cuts in the point at which the higher 40p rate of income tax starts to be applied. These more than offset the impact of the reduction in the additional rate of income tax from 50% to 45%, which gives a large benefit to a relatively small number of very high income individuals. However this picture changes if we include in our analysis the tax rises and the withdrawal of the personal allowance above £100,000 introduced immediately before the coalition came to office (the first element of the fiscal consolidation that began in April 2010): the richest households have lost the most both in cash terms and as a percentage of income from the overall tax and benefit changes that have taken place since the beginning of 2010. Including these tax rises increases the average household loss from measures we can model from £489 to £810 per year.
The figure above shows the average gains and losses within each income decile for all household types. There is, however, substantial variation in the impact of reforms within each income group depending on the household composition. As we see in Figure 2 below, working-age households without children in the middle to top of the income distribution (though not the very richest) have gained from reforms introduced by the coalition: this arises because this group has been less affected by the cuts to social security spending, while they have benefitted from the large increase in the personal allowance. Pensioners have been largely unaffected by tax and benefit reforms overall (though this is sensitive to how we define a ‘reform’)– gains from the ‘triple lock’ being applied to the basic state pension have offset losses from higher VAT and other changes. Working-age households with children, by contrast, have lost more on average than other household types at each income level, as households with children have greater entitlement to benefits and benefits directed at families with children have been reduced (notably, through freezing child benefit, the high-income child benefit charge and means-testing child tax credit more aggressively).
Figure 2. Impact of tax and benefit reforms, May 2010 - May 2015 inclusive [get the data for this graph]
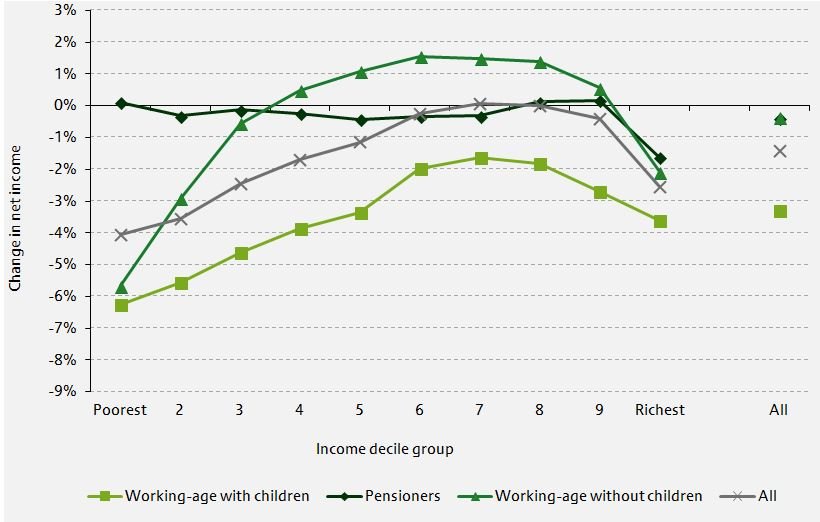
Notes & Source: As for Figure 1.
What about the changes that the different parties are proposing to introduce in the next parliament? The Conservatives have proposed substantial income tax cuts that would mainly benefit those on middle and higher incomes and a two-year freeze on most working age benefits that would mainly have adverse effects for the poorer half of working-age households. The Liberal Democrats also wish to increase the income tax personal allowance, which will again benefit middle- to higher-income households the most, but plan tax rises on the richest households through higher capital gains tax rates and additional council tax bands on high-value properties. Labour would also increase taxes on richer households with a separate ‘mansion tax’ on high-value properties and increasing the additional rate of income tax back to 50%. Their plans for introducing a 10% tax rate on the first slice of taxable income would have an almost identical effect as increasing the personal allowance, though are more modest in scope and would be offset by their proposal to remove the new transferable personal allowance for some married couples. We will be producing analysis of the distributional impacts of the different parties’ plans as more details become available closer to the election.
IFS election 2015 publications
Briefing notes
James Browne and William Elming, 'The effect of the coalition’s tax and benefit changes on household incomes and work incentives', Institute for Fiscal Studies: 23 January 2015, IFS briefing note BN159, election briefing note 2015 No. 2, ISBN: 978-1-909463-73-8